Average Ratings 27 Ratings
Average Ratings 0 Ratings
Similar Products
-
New RelicAround 25 million engineers work across dozens of distinct functions. Engineers are using New Relic as every company is becoming a software company to gather real-time insight and trending data on the performance of their software. This allows them to be more resilient and provide exceptional customer experiences. New Relic is the only platform that offers an all-in one solution. New Relic offers customers a secure cloud for all metrics and events, powerful full-stack analytics tools, and simple, transparent pricing based on usage. New Relic also has curated the largest open source ecosystem in the industry, making it simple for engineers to get started using observability.
-
Site24x7Site24x7 provides unified cloud monitoring to support IT operations and DevOps within small and large organizations. The solution monitors real users' experiences on websites and apps from both desktop and mobile devices. DevOps teams can monitor and troubleshoot applications and servers, as well as network infrastructure, including private clouds and public clouds, with in-depth monitoring capabilities. Monitoring the end-user experience is done from more 100 locations around the globe and via various wireless carriers.
-
AdRem NetCrunchNetCrunch runs on Windows Server (virtual or physical) and allows for efficient, agentless network monitoring, network visibility and advanced alert and remediation action management system. It can monitor practically any device, system or data source in your network, as non standard data can be pushed to NetCrunch or read from log, file or database to be included in NetCrunch network atlas. Developed by AdRem Software, NetCrunch includes 540+ predefined monitoring packs and ready to use sensors to track and troubleshoot network services uptime, performance of switches, routers, storage devices and applications, cloud services, bandwidth, and traffic flow. AdRem NetCrunch supports monitoring of all major OS types, such as Linux, Windows, VMWare ESX/ESXi, Mac OS X, and BSD. It allows creating all types of live network maps, performance charts, flexible dashboards and graphical views that are updated automatically, displaying live status of any monitored device, connection link, metric or alert. Data collected by NetCrunch can be shared securely via web console or any of over 30 ready to use integrations with most popular help desk systems (Jira, Freshdesk) or group collaboration (Slack, MS Teams, PagerDuty, Trello).
-
LogicMonitorLogicMonitor is the leading SaaS-based, fully-automated observability platform for enterprise IT and managed service providers. Cloud-first and hybrid ready. LogicMonitor helps enterprises and managed service providers gain IT insights through comprehensive visibility into networks, cloud, applications, servers, log data and more within one unified platform. Drive collaboration and efficiency across IT and DevOps teams, in a fully secure, intelligently automated platform. By providing end-to-end observability for enterprise businesses, LogicMonitor connects coders to consumers, customer experience to the cloud, infrastructure to applications and business insights into instant actions. Maximize uptime, optimize end-user experience, predict what comes next, and keep your business fearlessly moving forward.
-
DynatraceThe Dynatrace software intelligence platform revolutionizes the way organizations operate by offering a unique combination of observability, automation, and intelligence all within a single framework. Say goodbye to cumbersome toolkits and embrace a unified platform that enhances automation across your dynamic multicloud environments while facilitating collaboration among various teams. This platform fosters synergy between business, development, and operations through a comprehensive array of tailored use cases centralized in one location. It enables you to effectively manage and integrate even the most intricate multicloud scenarios, boasting seamless compatibility with all leading cloud platforms and technologies. Gain an expansive understanding of your environment that encompasses metrics, logs, and traces, complemented by a detailed topological model that includes distributed tracing, code-level insights, entity relationships, and user experience data—all presented in context. By integrating Dynatrace’s open API into your current ecosystem, you can streamline automation across all aspects, from development and deployment to cloud operations and business workflows, ultimately leading to increased efficiency and innovation. This cohesive approach not only simplifies management but also drives measurable improvements in performance and responsiveness across the board.
-
ManageEngine OpManagerOpManager is the ideal end-to-end network monitoring tool for your organization's network. With OpManager, you can keep a close eye on health, performance, and availability levels of all network devices. This includes monitoring switches, routers, LANs, WLCs, IP addresses and firewalls. Insights into your hardware health and performance; monitor CPU, memory, temperature, disk usage, and more to improve efficiency. Seamlessly manage faults and alerts with instant notifications and detailed logs. Streamlined workflows facilitate easy set-up to execute quick diagnosis and corrective measures. The solution also comes with powerful visualization tools such as business views, 3d data center views, topology maps, heat maps, and customizable dashboards. Get proactive in capacity planning and decision-making with over 250 predefined reports covering all important metrics and areas in your network. Overall, OpManager's detailed management capabilities make it the ideal solution for IT administrators to achieve network resiliency and efficiency.
-
Paessler PRTGPaessler PRTG is an all-inclusive monitoring solution with an intuitive, user-friendly interface powered by a cutting-edge monitoring engine. It optimizes connections and workloads, reduces operational costs, and prevents outages. It also saves time and controls service level agreements (SLAs). This solution includes specialized monitoring features such as flexible alerting, cluster failover, distributed monitoring, maps, dashboards, and in-depth reporting.
-
IBM InstanaIBM Instana sets the benchmark for incident prevention, offering comprehensive full-stack visibility with one-second precision and a notification time of just three seconds. In the current landscape of rapidly evolving and intricate cloud infrastructures, the financial repercussions of an hour of downtime can soar into the six-figure range or more. Conventional application performance monitoring (APM) tools often fall short, lacking the speed and depth required to effectively address and contextualize technical issues, and they usually necessitate extensive training for super users before they can be utilized effectively. In contrast, IBM Instana Observability transcends the limitations of standard APM tools by making observability accessible to a wider audience, enabling individuals from DevOps, SRE, platform engineering, ITOps, and development teams to obtain the necessary data and context without barriers. The Instana Dynamic APM functions through a specialized agent architecture, utilizing sensors—automated, lightweight programs specifically designed to monitor particular entities and ensure optimal performance. As a result, organizations can respond to incidents proactively and maintain a higher level of service continuity.
-
NMISFirstWave’s NMIS is a network management system that provides fault, performance, configuration management, performance graphs, and threshold alerts. Business rules allow for highly specific notification policies that can be used with multiple notification methods. FirstWave also enables partners, including some of the world’s largest telcos and managed service providers (MSPs), to protect their customers from cyber-attacks, while rapidly growing cybersecurity services revenues at scale. FirstWave provides a comprehensive end-to-end solution for network discovery, management, and cybersecurity for its partners globally.
-
groundcoverCloud-based solution for observability that helps businesses manage and track workload and performance through a single dashboard. Monitor all the services you run on your cloud without compromising cost, granularity or scale. Groundcover is a cloud-native APM solution that makes observability easy so you can focus on creating world-class products. Groundcover's proprietary sensor unlocks unprecedented granularity for all your applications. This eliminates the need for costly changes in code and development cycles, ensuring monitoring continuity.
Description
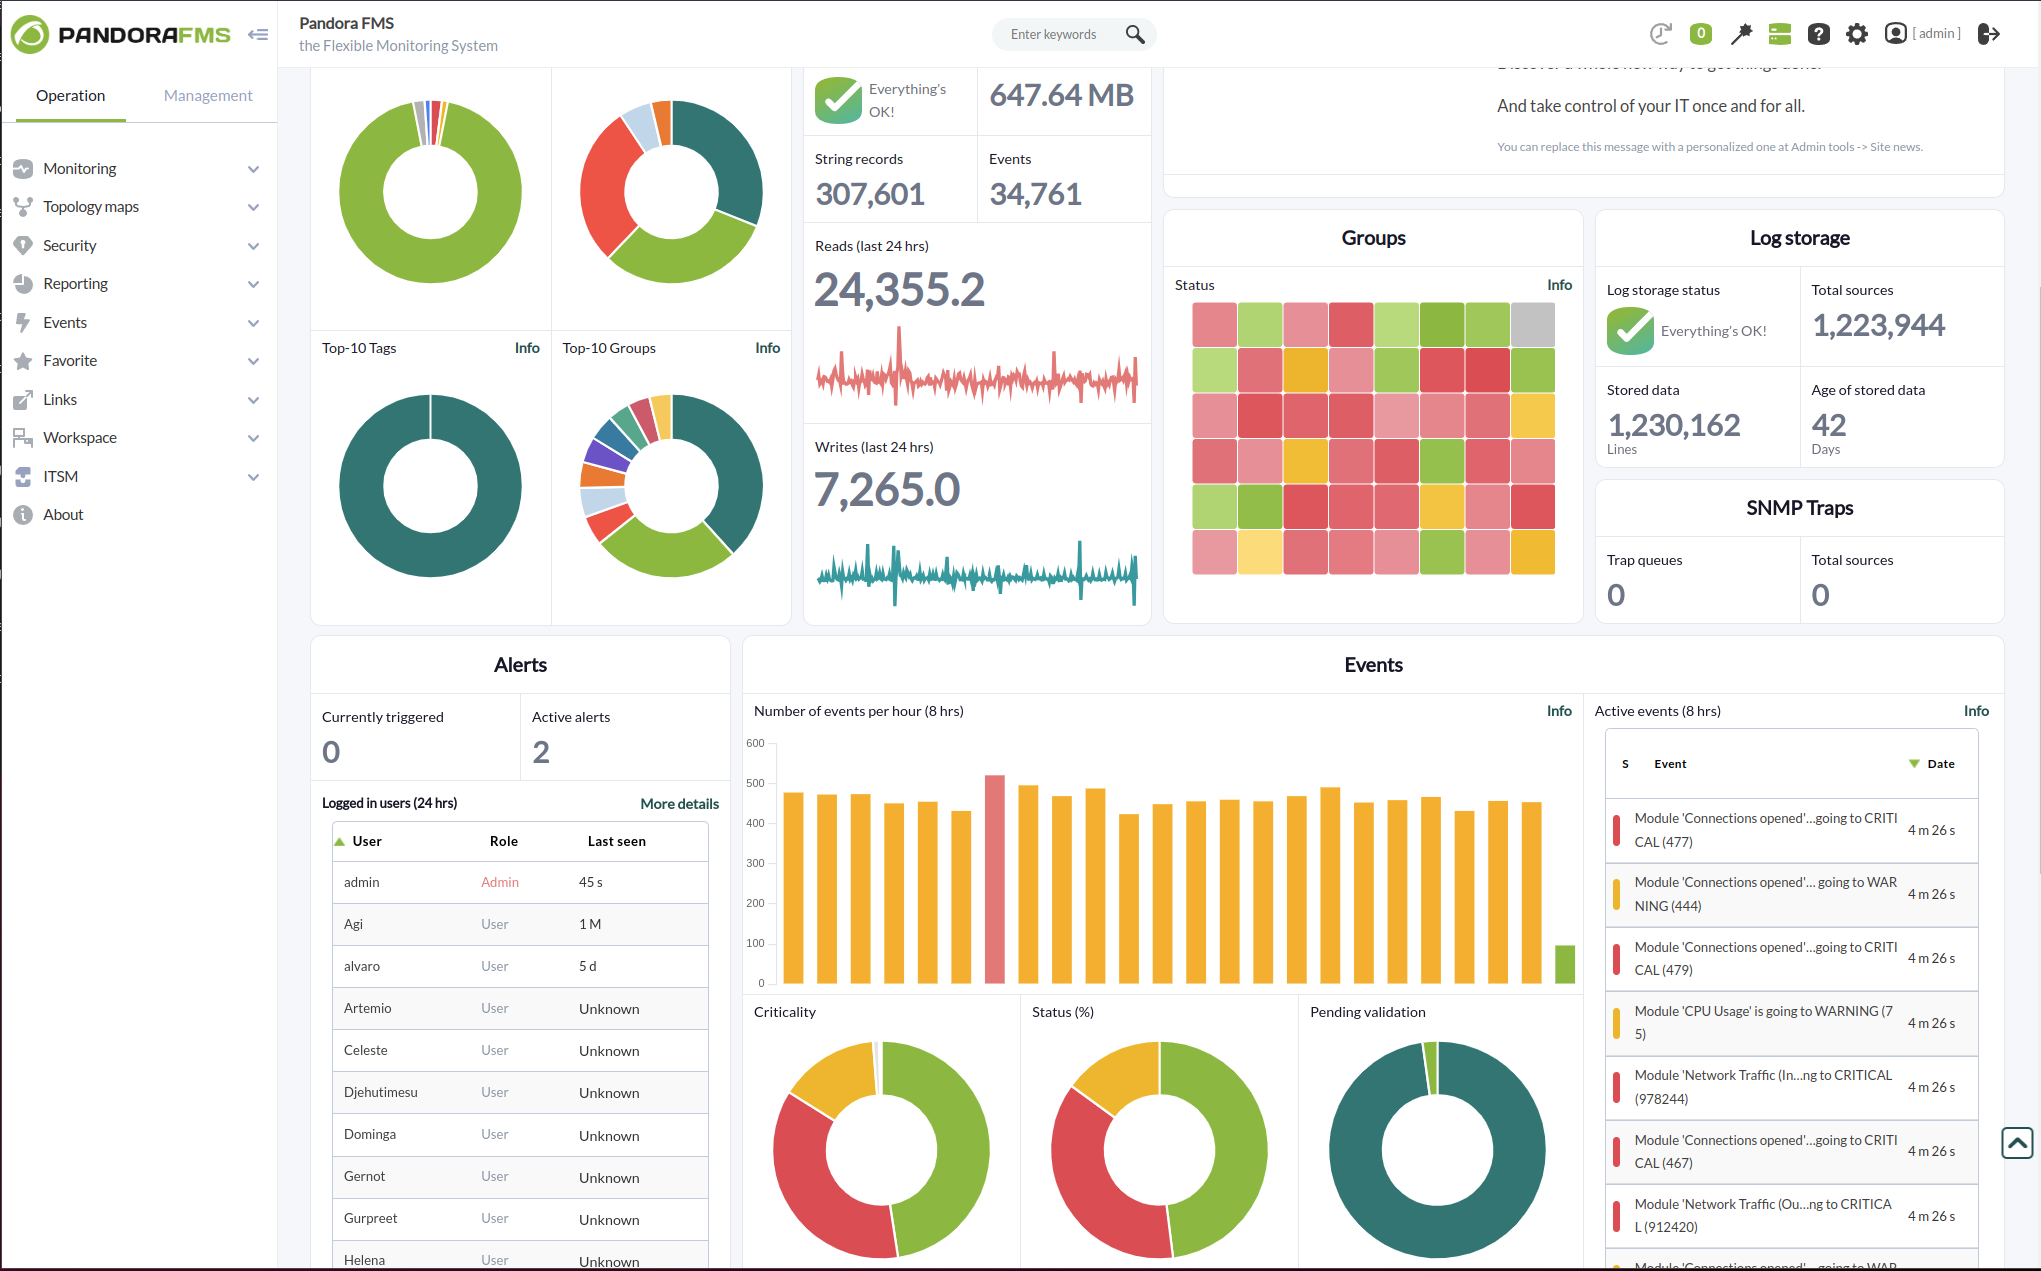
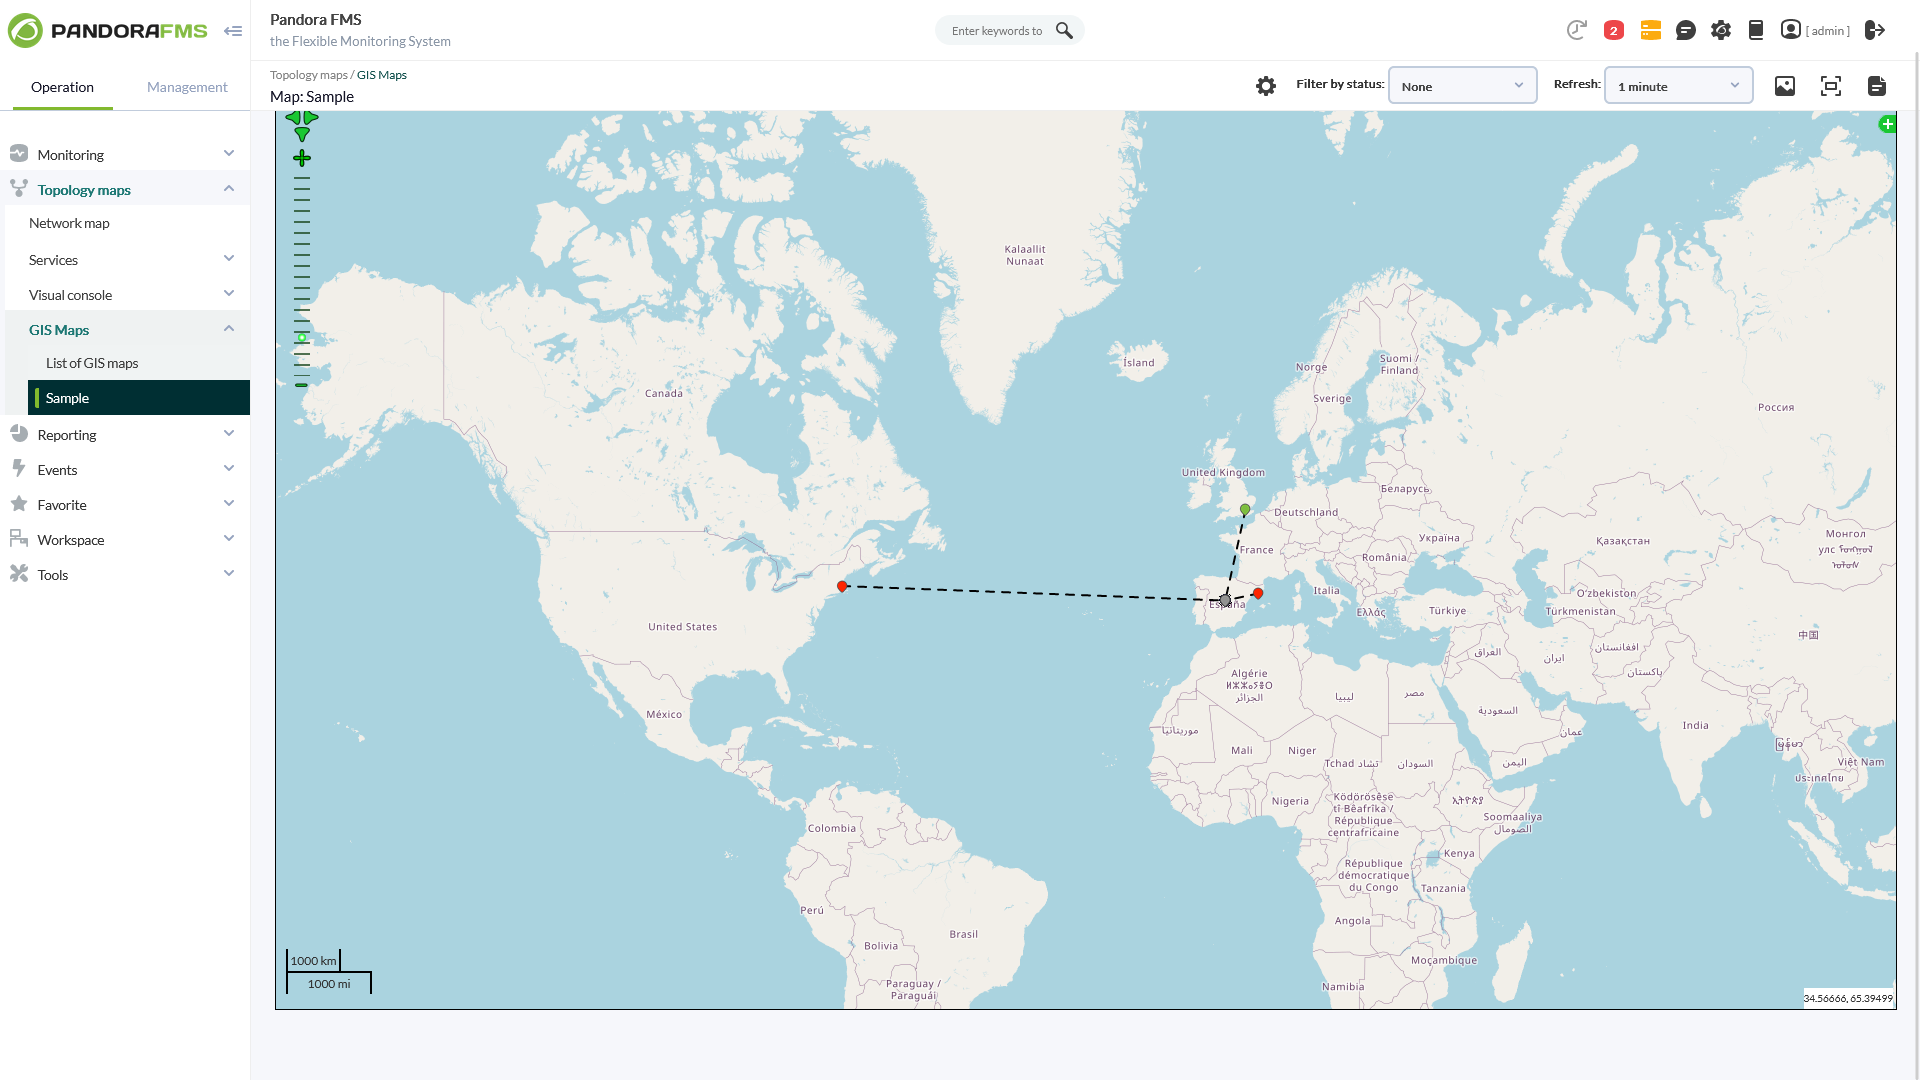
With more than 50,000 customer installations across the five continents, Pandora FMS is a truly all-in-one monitoring solution, covering all traditional silos for specific monitoring: servers, networks, applications, logs, synthetic/transactional, remote control, inventory, etc.
Pandora FMS allows you to quickly find and solve problems. It scales them so that they can be derived either from on-premise, multi-cloud, or both. You now have the ability to use your entire IT stack and analytics to solve any problem, even those that are difficult to find.
You can control and manage any technology and application with more than 500 plugins, including SAP, Oracle, Lotus or Citrix, Jboss, VMware, AWS and SQL Server.
Description
Reduce your infrastructure expenses by a third, cut data center upgrades by 75%, and reclaim 30% of your engineering time through enhanced resource management strategies. As applications become increasingly intricate, they can overwhelm your teams as they struggle to meet ever-changing demands. Often, when application performance falters, teams find themselves responding too late, addressing issues at a human pace. To prevent service interruptions, businesses may resort to overprovisioning resources, which can lead to expensive miscalculations that fail to yield the desired results. The IBM® Turbonomic® Application Resource Management (ARM) platform helps eliminate this uncertainty, leading to significant savings in both time and finances. By automating essential actions in real-time without the need for human oversight, it ensures the optimal utilization of compute, storage, and network resources for your applications across all layers of the technology stack. Ultimately, this proactive approach allows teams to focus on innovation rather than maintenance.
API Access
Has API
API Access
Has API


Integrations
Azure Marketplace
Apache Tomcat
Aruba Cloud
BMC Helix Remedyforce
BlackBerry Notes
Cisco Nexus Dashboard Fabric Controller
Elastic
Grafana
IBM Informix
Linode
Integrations
Azure Marketplace
Apache Tomcat
Aruba Cloud
BMC Helix Remedyforce
BlackBerry Notes
Cisco Nexus Dashboard Fabric Controller
Elastic
Grafana
IBM Informix
Linode
Pricing Details
€90/month
Free Trial
Free Version
Pricing Details
No price information available.
Free Trial
Free Version
Deployment
Web-Based
On-Premises
iPhone App
iPad App
Android App
Windows
Mac
Linux
Chromebook
Deployment
Web-Based
On-Premises
iPhone App
iPad App
Android App
Windows
Mac
Linux
Chromebook
Customer Support
Business Hours
Live Rep (24/7)
Online Support
Customer Support
Business Hours
Live Rep (24/7)
Online Support
Types of Training
Training Docs
Webinars
Live Training (Online)
In Person
Types of Training
Training Docs
Webinars
Live Training (Online)
In Person
Vendor Details
Company Name
Pandora FMS
Founded
2005
Country
Spain
Website
pandorafms.com
Vendor Details
Company Name
IBM
Founded
1911
Country
United States
Website
www.ibm.com/products/turbonomic
Product Features
Business Activity Monitoring
Alerts / Notifications
Business Process Management
Cross Application Analysis
Email Monitoring
Events Monitoring
KPI Monitoring
Pre-Configured Events
Reporting / Analytics
Workflow Management
Cloud Management
Access Control
Billing & Provisioning
Capacity Analytics
Cost Management
Demand Monitoring
Multi-Cloud Management
Performance Analytics
SLA Management
Supply Monitoring
Workflow Approval
Database Monitoring
Anomaly Detection
Autodiscovery
Capacity Planning
Dashboard
Dependency Tracking
Historical Trend Analysis
Multitenancy
Notifications / Alerts
Performance Monitoring
Permissions / Access Controls
Predictive Analytics
Prioritization
Query Analysis
Resource Optimization
Troubleshooting
IT Alerting
Alert Noise Reduction
Alert Routing
Dynamic Notifications
Enriched Incident Context
Escalation Policies
Incident History Audit
Multi-User Alerting
Multiple Alert Types
On-Call Management
Rich HTML Email Notifications
IT Infrastructure Monitoring
Alerts / Notifications
Application Monitoring
Bandwidth Monitoring
Capacity Planning
Configuration Change Management
Data Movement Monitoring
Health Monitoring
Multi-Platform Support
Performance Monitoring
Point-in-Time Visibility
Reporting / Analytics
Virtual Machine Monitoring
Network Mapping
Color Codes / Icons
Compliance Management
Device Auto Discovery
Hierarchical Mapping
Location-Based Mapping
Map Exporting
On-Demand Mapping
Reporting/Analytics
Self-Updating Maps
Web Traffic Reporting
Network Monitoring
Bandwidth Monitoring
Baseline Manager
Diagnostic Tools
IP Address Monitoring
Internet Usage Monitoring
Real Time Analytics
Resource Management
SLA Monitoring
Server Monitoring
Uptime Monitoring
Web Traffic Reporting
RMM
Deployment Management
For MSPs
IT Asset Management
Mobile Access
Network Monitoring
Patch Management
Real-time Alerts
Remediation Management
Server Management
CPU Monitoring
Credential Management
Database Servers
Email Monitoring
Event Logs
History Tracking
Patch Management
Scheduling
User Activity Monitoring
Virtual Machine Monitoring
System Monitoring
Alerts / Notifications
Antivirus Management
Data Backup / Recovery
Device Monitoring
Inventory Management
Patch Management
Policy-based Automation
Remote Monitoring
Reporting / Analytics
Risk Analysis
Server Monitoring
Service Configuration Management
Website Monitoring
Availability Testing
Event Logs
Event-Based Notifications
FTP Monitoring
Mail Server Monitoring
Maintenance Scheduling
Performance Metrics
Real Time Monitoring
Transaction Monitoring
Uptime Reporting
Product Features
Application Performance Monitoring (APM)
Baseline Manager
Diagnostic Tools
Full Transaction Diagnostics
Performance Control
Resource Management
Root-Cause Diagnosis
Server Performance
Trace Individual Transactions
Cloud Cost Management
Cost Reduction Optimization
Dashboard
Data Import/Export
Data Storage
Data Visualization
Resource Usage Reporting
Roles / Permissions
Spend and Cost Reporting
Cloud Management
Access Control
Billing & Provisioning
Capacity Analytics
Cost Management
Demand Monitoring
Multi-Cloud Management
Performance Analytics
SLA Management
Supply Monitoring
Workflow Approval
Data Center Management
Audit Trail
Behavior-Based Acceleration
Cross Reference System
Device Auto Discovery
Diagnostic Testing
Import / Export Data
JCL Management
Multi-Platform
Multi-User
Power Management
Sarbanes-Oxley Compliance
Database Monitoring
Anomaly Detection
Autodiscovery
Capacity Planning
Dashboard
Dependency Tracking
Historical Trend Analysis
Multitenancy
Notifications / Alerts
Performance Monitoring
Permissions / Access Controls
Predictive Analytics
Prioritization
Query Analysis
Resource Optimization
Troubleshooting
IT Alerting
Alert Noise Reduction
Alert Routing
Dynamic Notifications
Enriched Incident Context
Escalation Policies
Incident History Audit
Multi-User Alerting
Multiple Alert Types
On-Call Management
Rich HTML Email Notifications
Virtualization
Archiving & Retention
Capacity Monitoring
Data Mobility
Desktop Virtualization
Disaster Recovery
Namespace Management
Performance Management
Version Control
Virtual Machine Monitoring