Average Ratings 1 Rating
Average Ratings 0 Ratings
Average Ratings 27 Ratings
Similar Products
-
AdRem NetCrunchNetCrunch is a next-gen, agentless infrastructure and traffic network monitoring system designed for hybrid, multi-site, and fast changing infrastructures. It combines real-time observability with alert automation and intelligent escalation to eliminate the overhead and limitations of legacy tools like PRTG or SolarWinds. NetCrunch supports agentless monitoring of thousands of nodes from a single server-covering physical devices, virtual machines, servers, traffic flows, cloud services (AWS, Azure, GCP), SNMP, syslogs, Windows Events, IoT, telemetry, and more. Unlike sensor-based tools, NetCrunch uses node-based licensing and policy-driven configuration to streamline monitoring, reduce costs, and eliminate sensor micromanagement. 670+ built-in monitoring packs apply instantly based on device type, ensuring consistency across the network. NetCrunch delivers real-time, dynamic maps and dashboards that update without manual refreshes, giving users immediate visibility into issues and performance. Its smart alerting engine features root cause correlation, suppression, predictive triggers, and over 40 response actions including scripts, API calls, notifications, and integrations with Jira, Teams, Slack, Amazon SNS, MQTT, PagerDuty, and more. Its powerful REST API makes NetCrunch perfect for flow automation, including integration with asset management, production/IoT/operations monitoring and other IT systems with ease. Whether replacing an aging platform or modernizing enterprise observability, NetCrunch offers full-stack coverage with unmatched flexibility. Fast to deploy, simple to manage, and built to scale-NetCrunch is the smarter, faster, and future-ready monitoring system. Designed for on-prem (including air-gapped), cloud self-hosted or hybrid networks.
-
Site24x7Site24x7 provides unified cloud monitoring to support IT operations and DevOps within small and large organizations. The solution monitors real users' experiences on websites and apps from both desktop and mobile devices. DevOps teams can monitor and troubleshoot applications and servers, as well as network infrastructure, including private clouds and public clouds, with in-depth monitoring capabilities. Monitoring the end-user experience is done from more 100 locations around the globe and via various wireless carriers.
-
ManageEngine OpManagerOpManager is the ideal end-to-end network monitoring tool for your organization's network. With OpManager, you can keep a close eye on health, performance, and availability levels of all network devices. This includes monitoring switches, routers, LANs, WLCs, IP addresses and firewalls. Insights into your hardware health and performance; monitor CPU, memory, temperature, disk usage, and more to improve efficiency. Seamlessly manage faults and alerts with instant notifications and detailed logs. Streamlined workflows facilitate easy set-up to execute quick diagnosis and corrective measures. The solution also comes with powerful visualization tools such as business views, 3d data center views, topology maps, heat maps, and customizable dashboards. Get proactive in capacity planning and decision-making with over 250 predefined reports covering all important metrics and areas in your network. Overall, OpManager's detailed management capabilities make it the ideal solution for IT administrators to achieve network resiliency and efficiency.
-
AuvikAuvik Network Management is a network management and monitoring software designed to empower IT professionals with deep visibility, automation, and control over their network infrastructure. This innovative platform is trusted by businesses of all sizes to streamline network operations, enhance security, and optimize performance. One of Auvik's standout features is its real-time network mapping and discovery capabilities. It automatically generates interactive, visual maps of your network topology, allowing you to easily identify devices, connections, and potential bottlenecks. This invaluable insight helps in planning and optimizing network architecture for maximum efficiency.
-
NMISFirstWave’s NMIS is a network management system that provides fault, performance, configuration management, performance graphs, and threshold alerts. Business rules allow for highly specific notification policies that can be used with multiple notification methods. FirstWave also enables partners, including some of the world’s largest telcos and managed service providers (MSPs), to protect their customers from cyber-attacks, while rapidly growing cybersecurity services revenues at scale. FirstWave provides a comprehensive end-to-end solution for network discovery, management, and cybersecurity for its partners globally.
-
NetBrainSince 2004, NetBrain has transformed network operations with its no-code automation platform, helping teams systematically shift left by turning complex processes into streamlined workflows. By unifying AI and automation, NetBrain delivers actionable hybrid network-wide observability, automates troubleshooting, and enables safe change management to boost efficiency, reduce MTTR, and mitigate risk, enabling IT organizations to proactively drive innovation. Get network-wide and contextualized analysis across your multi-vendor, multi-cloud network Visualize and document the entire hybrid network using dynamic network maps and end-to-end paths Automate network discovery and ensure data accuracy for a single source of truth Auto-discover and decode your network's golden configurations, discover day 1 issues, and automate configuration drift prevention Automate pre- and post-validations for network changes with application performance context understanding Automate collaborative troubleshooting from human to machine
-
UptrendsUptrends is all about cloud-based website performance that keeps track of performance, uptime, and functionality of your websites and APIs. The 24/7 monitoring service that proactively test your website and monitor multi-step transactions. Let’s face it—the Internet is a fragile thing. Stuff breaks or slows every now and then. Uptrends lets you know when it does and what exactly happened. Feel free to try Uptrends for 30 days with our free trial!
-
ConnectWise RMMManage your clients' IT infrastructure. Don't settle. ConnectWise RMM, a ConnectWise software solution that provides proactive tools as well as NOC services, will exceed your clients' expectations. Smart patching is more important than ever as the number of vulnerabilities is increasing every year. We automatically test and deploy patches when possible and limit harmful patches. Clients are protected while you spend less time managing endpoints, and more time growing your company. It is difficult to find, afford and retain high-quality talent. 81% of IT leaders believe it's difficult to find the right talent. Add ConnectWise RMM and NOC services to get the expertise and problem solving you need to be the advisor your clients require--without increasing headcount.
-
Paessler PRTGPaessler PRTG is an all-inclusive monitoring solution with an intuitive, user-friendly interface powered by a cutting-edge monitoring engine. It optimizes connections and workloads, reduces operational costs, and prevents outages. It also saves time and controls service level agreements (SLAs). This solution includes specialized monitoring features such as flexible alerting, cluster failover, distributed monitoring, maps, dashboards, and in-depth reporting.
-
PulsewayPulseway, a remote monitoring and management software (RMM) for IT departments and MSPs, allows you to have complete control over your entire IT environment. Pulseway is easy to use and quick-to-deploy. It ensures that IT issues are identified, monitored, and resolved as soon as possible. The platform provides complete visibility through the Pulseway dashboard, advanced automation, remote management, OS & third party patch management, network monitoring and IT automation, custom reports as well as complete command traceability, email notification, and many other features. We also offer add-ons to endpoint protection, business management (PSA), backup & disaster restoration software, and integration with top AV providers to give your IT stack the power it deserves. Pulseway is used by over 6,000 customers around the world every day to manage their IT infrastructure. Get a 14-day free trial.
Description
Netreo is the best full-stack IT infrastructure management and observation platform. Netreo is a single source for truth for proactive performance monitoring and availability monitoring of large enterprise networks, infrastructure, and applications.
Our solution is used by:
IT executives should have full visibility of the business service, right down to the infrastructure and network that supports them.
IT Engineering departments are used as a decision support system to plan and architect modern solutions.
IT Operations teams can have real-time visibility into what is going wrong in their environment, which bottlenecks exist, and who it is affecting.
All of these insights are available for systems and vendor mix in large heterogeneous environments that are constantly changing. We have a growing list of vendors that we support (over 350 integrations), including network vendors, storage, virtualization, and servers.
Description
OpenText AI Operations Management (Operations Bridge) is a comprehensive AIOps platform designed to provide enterprises with full-stack visibility and automated management of IT operations across cloud, on-premises, and XaaS environments. The solution dynamically discovers services and dependent resources, consolidating performance and event data from multiple sources to improve IT observability and accelerate incident resolution. Its AI-powered event correlation intelligently groups symptomatic alerts, reducing event noise and speeding up root cause identification. Deployment options include flexible SaaS and on-premises models, enabling organizations to balance control, speed, and scalability according to their strategic priorities. Embedded automation workflows enable rapid remedial actions through thousands of pre-built operations, minimizing manual intervention. The platform also delivers detailed service performance insights to pinpoint resource bottlenecks affecting user experience. OpenText AI Operations Management integrates seamlessly with existing toolchains to provide actionable intelligence and faster mean time to repair. It helps IT teams proactively manage service health and enhance operational efficiency.
Description
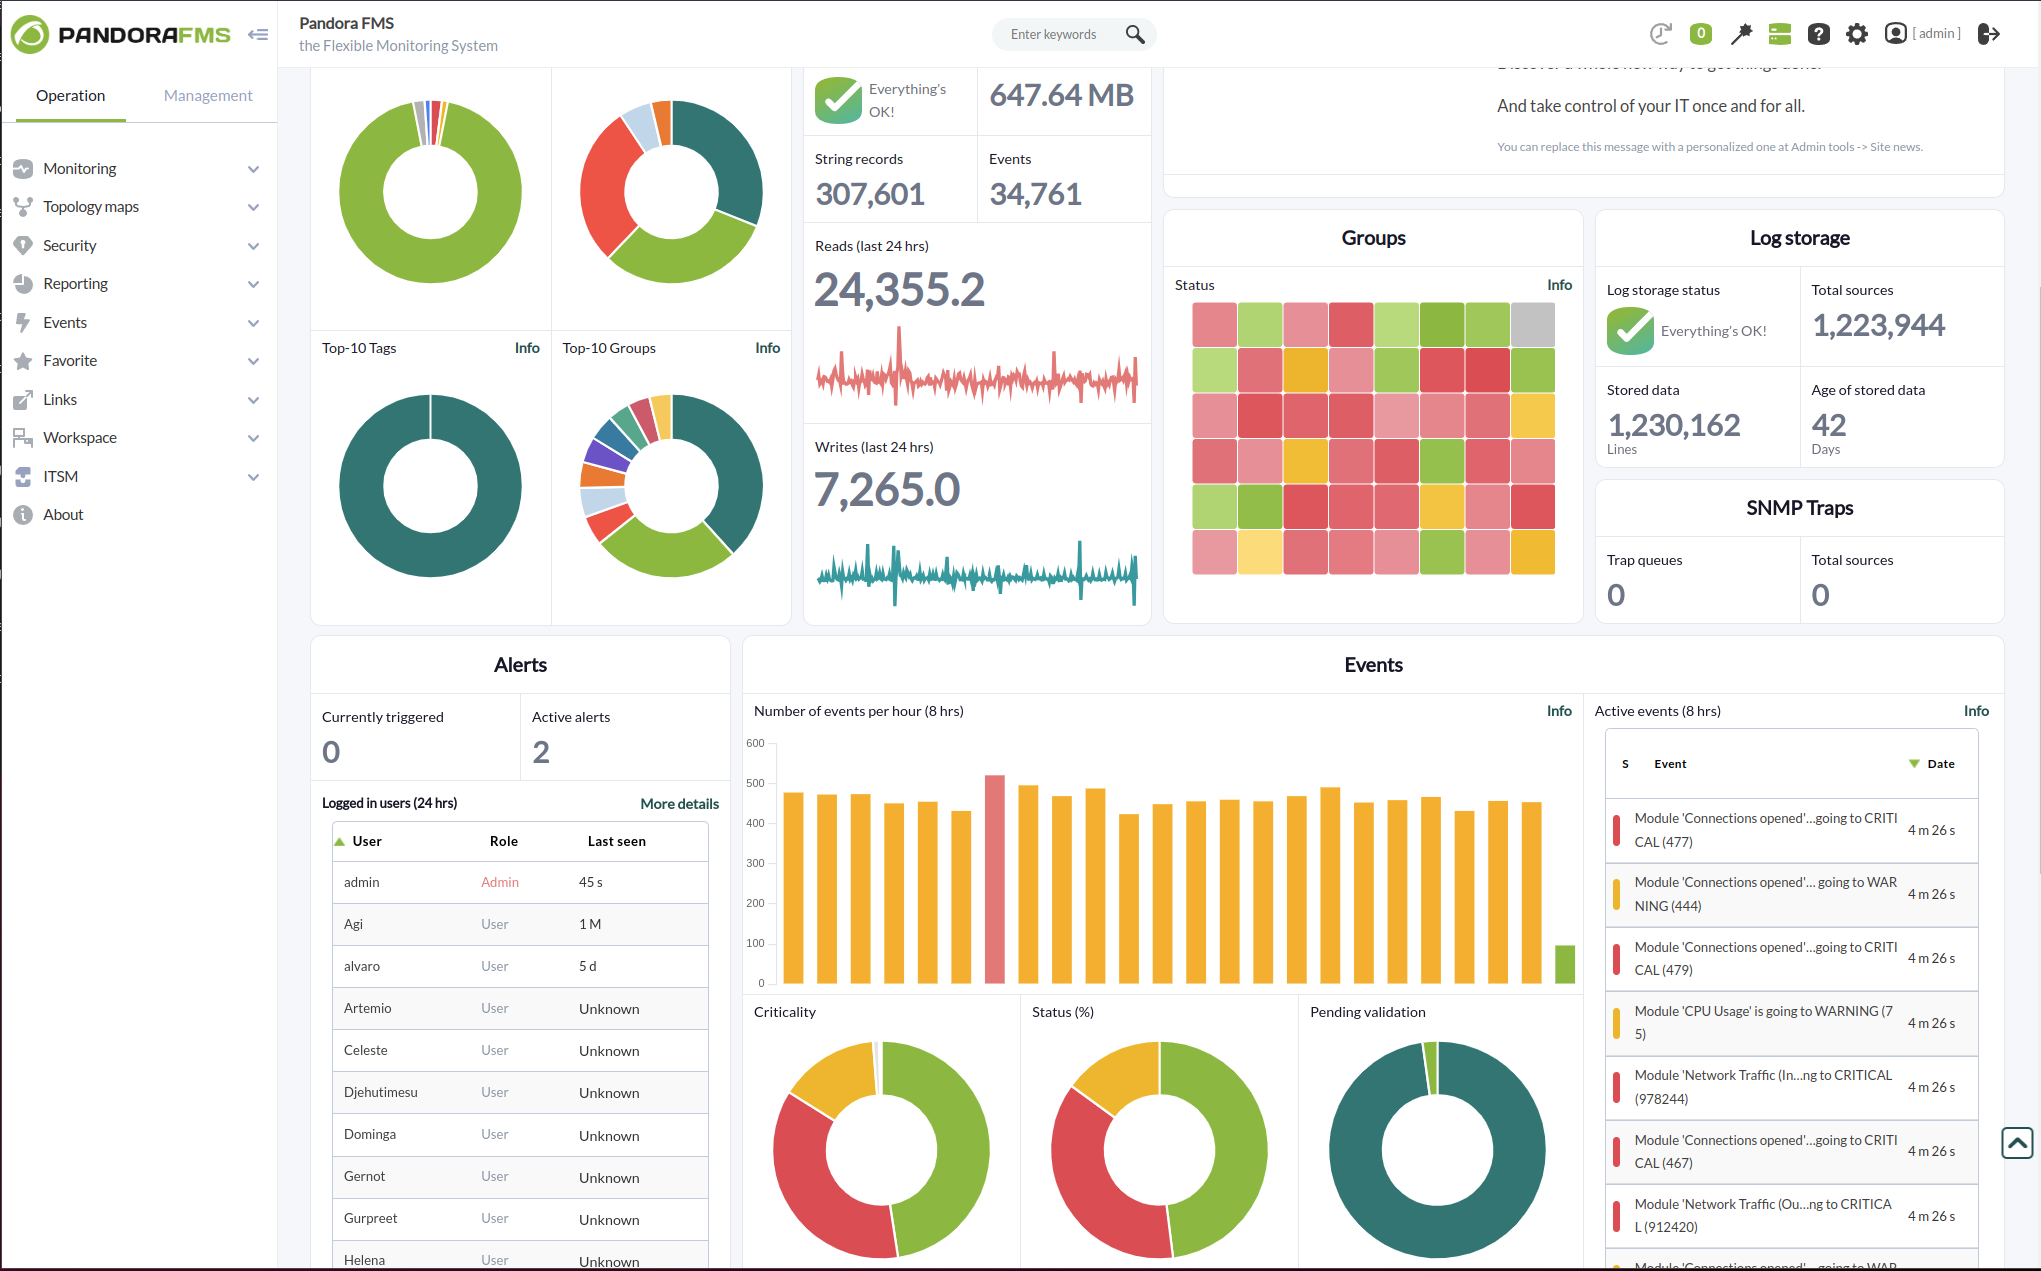
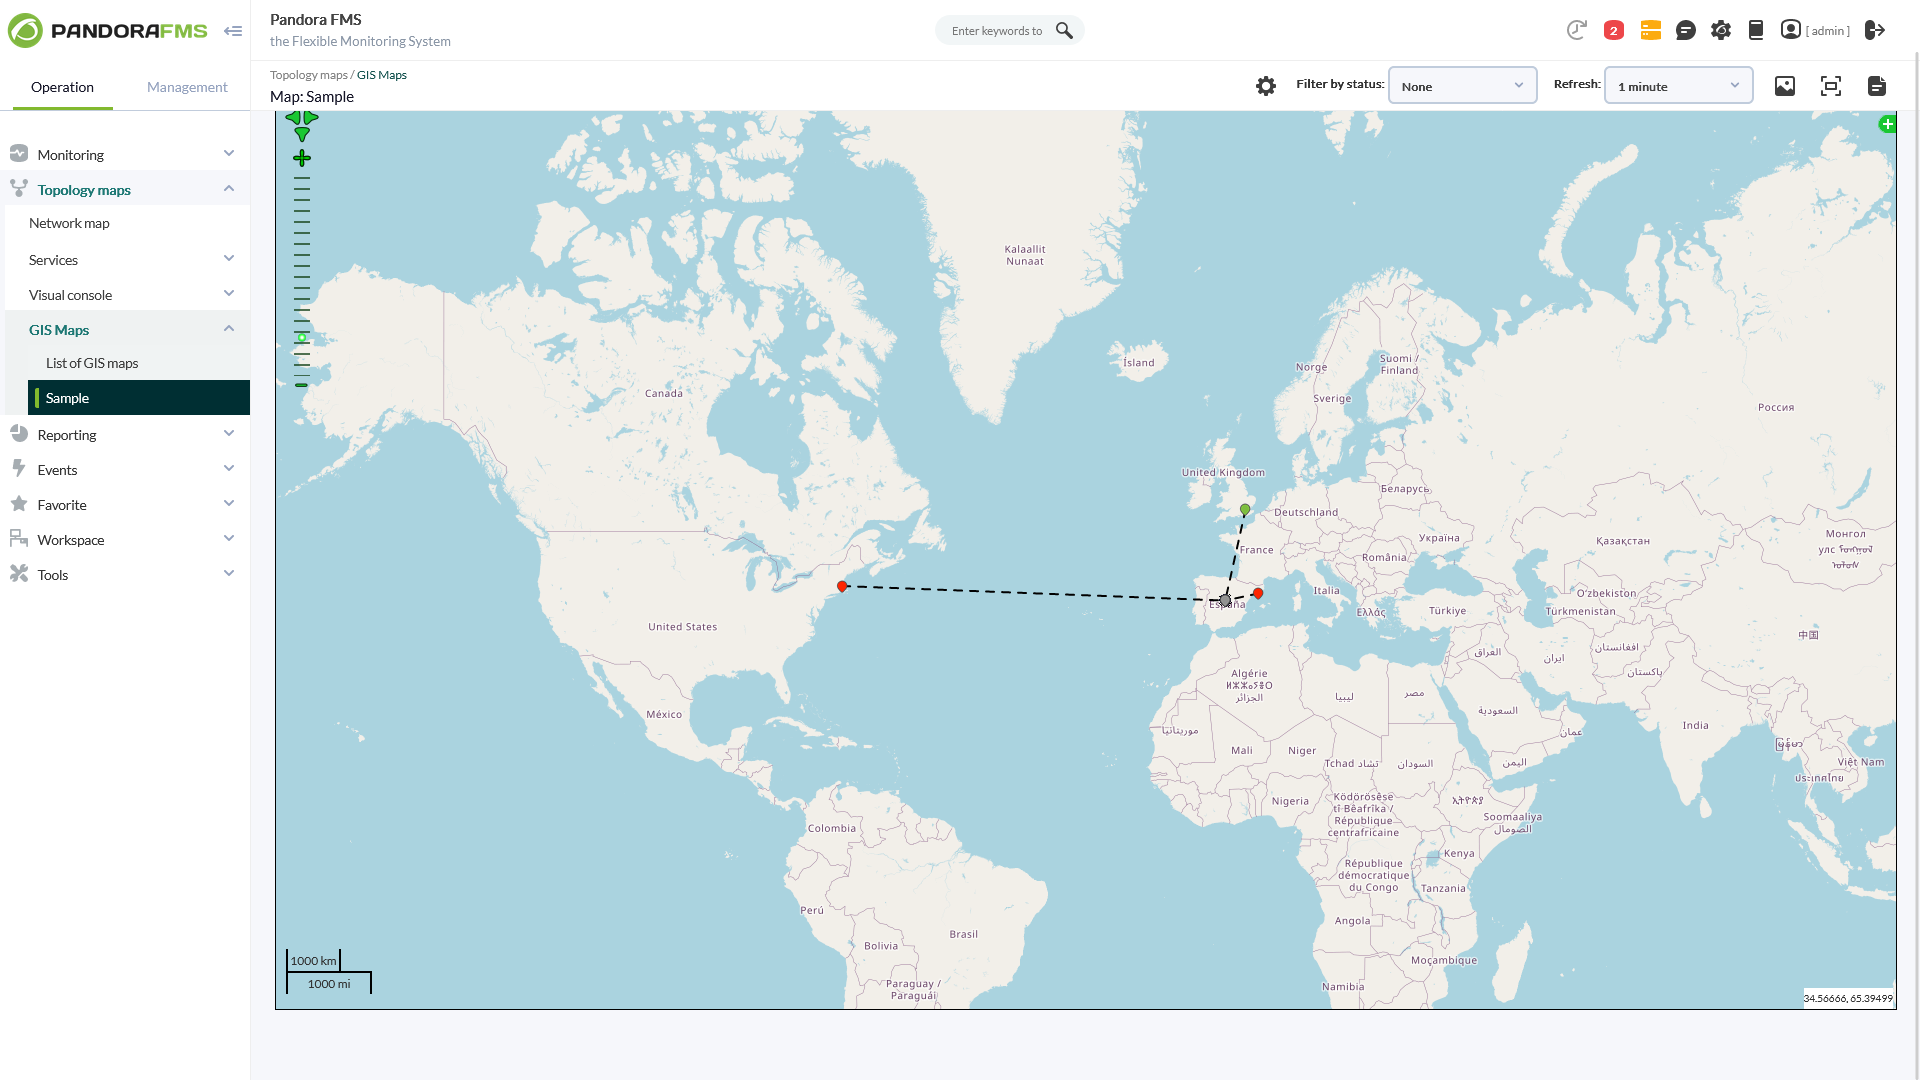
With more than 50,000 customer installations across the five continents, Pandora FMS is a truly all-in-one monitoring solution, covering all traditional silos for specific monitoring: servers, networks, applications, logs, synthetic/transactional, remote control, inventory, etc.
Pandora FMS allows you to quickly find and solve problems. It scales them so that they can be derived either from on-premise, multi-cloud, or both. You now have the ability to use your entire IT stack and analytics to solve any problem, even those that are difficult to find.
You can control and manage any technology and application with more than 500 plugins, including SAP, Oracle, Lotus or Citrix, Jboss, VMware, AWS and SQL Server.
API Access
Has API
API Access
Has API
API Access
Has API


Integrations
Amazon Web Services (AWS)
MySQL
PostgreSQL
VMware ESXi
Aruba Cloud
Cherwell Software
DERDACK Enterprise Alert
Deep Instinct
FreeBSD
Google Cloud Platform
Integrations
Amazon Web Services (AWS)
MySQL
PostgreSQL
VMware ESXi
Aruba Cloud
Cherwell Software
DERDACK Enterprise Alert
Deep Instinct
FreeBSD
Google Cloud Platform
Integrations
Amazon Web Services (AWS)
MySQL
PostgreSQL
VMware ESXi
Aruba Cloud
Cherwell Software
DERDACK Enterprise Alert
Deep Instinct
FreeBSD
Google Cloud Platform
Pricing Details
$5/resource/mo
Free Trial
Free Version
Pricing Details
No price information available.
Free Trial
Free Version
Pricing Details
€90/month
Free Trial
Free Version
Deployment
Web-Based
On-Premises
iPhone App
iPad App
Android App
Windows
Mac
Linux
Chromebook
Deployment
Web-Based
On-Premises
iPhone App
iPad App
Android App
Windows
Mac
Linux
Chromebook
Deployment
Web-Based
On-Premises
iPhone App
iPad App
Android App
Windows
Mac
Linux
Chromebook
Customer Support
Business Hours
Live Rep (24/7)
Online Support
Customer Support
Business Hours
Live Rep (24/7)
Online Support
Customer Support
Business Hours
Live Rep (24/7)
Online Support
Types of Training
Training Docs
Webinars
Live Training (Online)
In Person
Types of Training
Training Docs
Webinars
Live Training (Online)
In Person
Types of Training
Training Docs
Webinars
Live Training (Online)
In Person
Vendor Details
Company Name
Netreo
Founded
2000
Country
United States
Website
www.netreo.com
Vendor Details
Company Name
OpenText
Founded
1991
Country
Canada
Website
www.opentext.com/products/ai-operations-management
Vendor Details
Company Name
Pandora FMS
Founded
2005
Country
Spain
Website
pandorafms.com
Product Features
Application Development
Access Controls/Permissions
Code Assistance
Code Refactoring
Collaboration Tools
Compatibility Testing
Data Modeling
Debugging
Deployment Management
Graphical User Interface
Mobile Development
No-Code
Reporting/Analytics
Software Development
Source Control
Testing Management
Version Control
Web App Development
Application Lifecycle Management
Administrator Level Control
Defect Tracking
Iteration Planning
Project Management
Release Management
Requirements Review
Task Management
Test Case Tracking
User Level Management
Version Control
Application Performance Monitoring (APM)
Baseline Manager
Diagnostic Tools
Full Transaction Diagnostics
Performance Control
Resource Management
Root-Cause Diagnosis
Server Performance
Trace Individual Transactions
Cloud Management
Access Control
Billing & Provisioning
Capacity Analytics
Cost Management
Demand Monitoring
Multi-Cloud Management
Performance Analytics
SLA Management
Supply Monitoring
Workflow Approval
Configuration Management
Access Control / Permissions
Application Deployment
Automated Provisioning
Infrastructure Automation
Node Management
Orchestration
Reporting Analytics / Visualization
Task Management
Container Management
Access Control
Application Development
Automatic Scaling
Build Automation
Container Health Management
Container Storage
Deployment Automation
File Isolation
Hybrid Deployments
Network Isolation
Orchestration
Shared File Systems
Version Control
Virtualization
Data Center Management
Audit Trail
Behavior-Based Acceleration
Cross Reference System
Device Auto Discovery
Diagnostic Testing
Import / Export Data
JCL Management
Multi-Platform
Multi-User
Power Management
Sarbanes-Oxley Compliance
Database
Backup and Recovery
Creation / Development
Data Migration
Data Replication
Data Search
Data Security
Database Conversion
Mobile Access
Monitoring
NOSQL
Performance Analysis
Queries
Relational Interface
Virtualization
Database Monitoring
Anomaly Detection
Autodiscovery
Capacity Planning
Dashboard
Dependency Tracking
Historical Trend Analysis
Multitenancy
Notifications / Alerts
Performance Monitoring
Permissions / Access Controls
Predictive Analytics
Prioritization
Query Analysis
Resource Optimization
Troubleshooting
DevOps
Approval Workflow
Dashboard
KPIs
Policy Management
Portfolio Management
Prioritization
Release Management
Timeline Management
Troubleshooting Reports
Infrastructure-as-a-Service (IaaS)
Analytics / Reporting
Configuration Management
Data Migration
Data Security
Load Balancing
Log Access
Network Monitoring
Performance Monitoring
SLA Monitoring
IT Alerting
Alert Noise Reduction
Alert Routing
Dynamic Notifications
Enriched Incident Context
Escalation Policies
Incident History Audit
Multi-User Alerting
Multiple Alert Types
On-Call Management
Rich HTML Email Notifications
IT Infrastructure Monitoring
Alerts / Notifications
Application Monitoring
Bandwidth Monitoring
Capacity Planning
Configuration Change Management
Data Movement Monitoring
Health Monitoring
Multi-Platform Support
Performance Monitoring
Point-in-Time Visibility
Reporting / Analytics
Virtual Machine Monitoring
IT Service
Contract Management
IT Asset Management
Incident Management
Knowledge Management
Release Management
Self Service Portal
Service Catalog
Service Reporting
Ticket Management
Network Mapping
Color Codes / Icons
Compliance Management
Device Auto Discovery
Hierarchical Mapping
Location-Based Mapping
Map Exporting
On-Demand Mapping
Reporting/Analytics
Self-Updating Maps
Web Traffic Reporting
Network Monitoring
Bandwidth Monitoring
Baseline Manager
Diagnostic Tools
IP Address Monitoring
Internet Usage Monitoring
Real Time Analytics
Resource Management
SLA Monitoring
Server Monitoring
Uptime Monitoring
Web Traffic Reporting
Network Troubleshooting
Alerts / Escalation
Bandwidth Troubleshooting
Change Management
Configuration Management
Connectivity Management
Data Visualization
Historical Audit
Mobile Network Troubleshooting
Network Analysis
Network Monitoring
RMM
Deployment Management
For MSPs
IT Asset Management
Mobile Access
Network Monitoring
Patch Management
Real-time Alerts
Remediation Management
Server Management
CPU Monitoring
Credential Management
Database Servers
Email Monitoring
Event Logs
History Tracking
Patch Management
Scheduling
User Activity Monitoring
Virtual Machine Monitoring
System Monitoring
Alerts / Notifications
Antivirus Management
Data Backup / Recovery
Device Monitoring
Inventory Management
Patch Management
Policy-based Automation
Remote Monitoring
Reporting / Analytics
Risk Analysis
Server Monitoring
Service Configuration Management
Website Monitoring
Availability Testing
Event Logs
Event-Based Notifications
FTP Monitoring
Mail Server Monitoring
Maintenance Scheduling
Performance Metrics
Real Time Monitoring
Transaction Monitoring
Uptime Reporting
Product Features
Configuration Management
Access Control / Permissions
Application Deployment
Automated Provisioning
Infrastructure Automation
Node Management
Orchestration
Reporting Analytics / Visualization
Task Management
IT Alerting
Alert Noise Reduction
Alert Routing
Dynamic Notifications
Enriched Incident Context
Escalation Policies
Incident History Audit
Multi-User Alerting
Multiple Alert Types
On-Call Management
Rich HTML Email Notifications
IT Management
Capacity Monitoring
Compliance Management
Event Logs
Hardware Inventory
IT Budgeting
License Management
Patch Management
Remote Access
Scheduling
Software Inventory
User Activity Monitoring
Product Features
Business Activity Monitoring
Alerts / Notifications
Business Process Management
Cross Application Analysis
Email Monitoring
Events Monitoring
KPI Monitoring
Pre-Configured Events
Reporting / Analytics
Workflow Management
Cloud Management
Access Control
Billing & Provisioning
Capacity Analytics
Cost Management
Demand Monitoring
Multi-Cloud Management
Performance Analytics
SLA Management
Supply Monitoring
Workflow Approval
Database Monitoring
Anomaly Detection
Autodiscovery
Capacity Planning
Dashboard
Dependency Tracking
Historical Trend Analysis
Multitenancy
Notifications / Alerts
Performance Monitoring
Permissions / Access Controls
Predictive Analytics
Prioritization
Query Analysis
Resource Optimization
Troubleshooting
IT Alerting
Alert Noise Reduction
Alert Routing
Dynamic Notifications
Enriched Incident Context
Escalation Policies
Incident History Audit
Multi-User Alerting
Multiple Alert Types
On-Call Management
Rich HTML Email Notifications
IT Infrastructure Monitoring
Alerts / Notifications
Application Monitoring
Bandwidth Monitoring
Capacity Planning
Configuration Change Management
Data Movement Monitoring
Health Monitoring
Multi-Platform Support
Performance Monitoring
Point-in-Time Visibility
Reporting / Analytics
Virtual Machine Monitoring
Network Mapping
Color Codes / Icons
Compliance Management
Device Auto Discovery
Hierarchical Mapping
Location-Based Mapping
Map Exporting
On-Demand Mapping
Reporting/Analytics
Self-Updating Maps
Web Traffic Reporting
Network Monitoring
Bandwidth Monitoring
Baseline Manager
Diagnostic Tools
IP Address Monitoring
Internet Usage Monitoring
Real Time Analytics
Resource Management
SLA Monitoring
Server Monitoring
Uptime Monitoring
Web Traffic Reporting
RMM
Deployment Management
For MSPs
IT Asset Management
Mobile Access
Network Monitoring
Patch Management
Real-time Alerts
Remediation Management
Server Management
CPU Monitoring
Credential Management
Database Servers
Email Monitoring
Event Logs
History Tracking
Patch Management
Scheduling
User Activity Monitoring
Virtual Machine Monitoring
System Monitoring
Alerts / Notifications
Antivirus Management
Data Backup / Recovery
Device Monitoring
Inventory Management
Patch Management
Policy-based Automation
Remote Monitoring
Reporting / Analytics
Risk Analysis
Server Monitoring
Service Configuration Management
Website Monitoring
Availability Testing
Event Logs
Event-Based Notifications
FTP Monitoring
Mail Server Monitoring
Maintenance Scheduling
Performance Metrics
Real Time Monitoring
Transaction Monitoring
Uptime Reporting