Average Ratings 0 Ratings
Average Ratings 0 Ratings
Similar Products
-
BrandMap® 10Worldwide, professional researchers prefer a user-friendly and swift tool for the analysis and creation of presentation-ready biplots, correspondence maps, mdpref, and MCA maps. This powerful 64-bit software is compatible with both PCs and MACs. Our unique Brand Projector I enables users to compute and visually represent the necessary attribute alterations for repositioning a brand (column) to any desired location on a map. In addition, Brand Projector II offers researchers the ability to modify attributes (rows) interactively, allowing them to observe the corresponding movement of the brand (column) in real-time. This dynamic interaction enhances the understanding of brand positioning strategies significantly.
-
SiteKioskSiteKiosk Online is a turnkey, secure kiosk and digital signage software solution for Windows and Android devices. The company's easy-to-use and scalable application such as SiteKiosk helps protect the browser and operating system against manipulations and provides 24/7 maintenance-free operation.
-
FrontFaceFrontFace is a powerful on-premise digital signage & kiosk software product (not SaaS) that allows you to easily deploy flexible and very reliable interactive kiosk terminals, touchscreen frontends, as well as non-interactive public displays and digital signage applications, advertising or information displays, self-service kiosks, etc. FrontFace can display any kind of media format, whether you want to display text, images, photos, PDFs, videos, news tickers or even entire web pages (HTML5). But the best news is that you can use ANY Windows application that can print to create high-quality HD content for your display. Use PowerPoint, Word, Excel, etc. to create content for your playlists. Use the tools you are familiar with without having to invest in learning a new, complex design application! In addition, FrontFace comes with a plugin interface that allows you to extend the application's functionality with optional plugins. This includes the integration of external calendars (e.g. Office 365 Exchange Online or ICS or Excel) or vertical applications such as an accident statistics board or a dashboard. Content management is super easy with FrontFace. No programming are skills required.
-
HighchartsHighcharts, a Javascript-based charting library, makes it easy to add interactive charts and graphs to web or mobile projects of any size. Highcharts is used by more than 80% of the 100 biggest companies in the world, as well as thousands of developers from a variety of industries, including finance, publishing, application development, and data science. Highcharts is in active development since 2009. It remains a favorite among developers due to its robust feature set and ease-of-use documentation, accessibility features and vibrant community.
-
JOpt.TourOptimizerIf you are developing software for Logistics Dispatch Solutions, which contain challenges: -For staff dispatching, such as sales reps, mobile service, or workforce? -For truck shipment allocation in daily transportation and logistics (scheduling, tour optimization, etc.)? -For waste management and District Planning? -Generally, highly constrained problem sets? And your product does not have an automized optimization engine? Then JOpt is the perfect fit for your product and can help you to save money, time, and workforce, letting you concentrate on your core business. JOpt.TourOptimizer is an adaptable component to solve VRP, CVRP, and VRPTW class problems for any route optimization in logistics or similar fields. It comes as a Java library or in Docker Container utilizing the Spring Framework and Swagger.
-
Azore CFDAzore is software for computational fluid dynamics. It analyzes fluid flow and heat transfers. CFD allows engineers and scientists to analyze a wide range of fluid mechanics problems, thermal and chemical problems numerically using a computer. Azore can simulate a wide range of fluid dynamics situations, including air, liquids, gases, and particulate-laden flow. Azore is commonly used to model the flow of liquids through a piping or evaluate water velocity profiles around submerged items. Azore can also analyze the flow of gases or air, such as simulating ambient air velocity profiles as they pass around buildings, or investigating the flow, heat transfer, and mechanical equipment inside a room. Azore CFD is able to simulate virtually any incompressible fluid flow model. This includes problems involving conjugate heat transfer, species transport, and steady-state or transient fluid flows.
-
viewneoExplore the transformative power of viewneo, a comprehensive digital signage solution tailored for businesses of all sizes, from bustling local shops to expansive global enterprises. Our advanced system integrates flawlessly with essential tools such as RFID readers and the pioneering viewneo Butler smart device gateway, redefining the effectiveness of visual communications. Enhance your digital displays with our extensive library of over 20 customizable plugins that include functionalities like real-time weather forecasts, interactive video walls, and seamless social media content integration from popular platforms like Instagram and Facebook. Viewneo’s intuitive Content Management System (CMS) streamlines the scheduling and distribution of content across various locations, ensuring efficient campaign management and maximized audience engagement. Leverage viewneo’s scalable solutions to elevate your advertising strategies and enhance customer communications. With viewneo, you can effortlessly transform your visual engagement strategy, making use of detailed analytics to track viewer interactions and adapt your content for the highest impact. Embrace the future of digital signage with viewneo, widely trusted for delivering sophist
-
ManageEngine EventLog AnalyzerEventLog Analyzer from Manage Engine is the industry's most affordable security information and event management software (SIEM). This cloud-based, secure solution provides all essential SIEM capabilities, including log analysis, log consolidation, user activity monitoring and file integrity monitoring. It also supports event correlation, log log forensics and log retention. Real-time alerting is possible with this powerful and secure solution. Manage Engine's EventLog Analyzer allows users to prevent data breaches, detect the root cause of security issues, and mitigate sophisticated cyber-attacks.
-
Quick ConsolsQuick Consols is a financial reporting consolidation software application that is specifically designed for complex companies and groups. Our software automates the consolidation of complex groups with multiple years ends, multiple currencies, and multiple ERP systems using a slice-and-dice approach to reporting. Quick Consols calculates the required reports and numbers accurately and consistently. Single company reporting and group consolidations made easy. Quick Consols also assists with business unit, profit centre and cost centre reporting. This give your time to be analyse data and provide useful insights into the business finances and operations. Our platform is easy to use and set up. The software allows unlimited users and provides unlimited support.
-
TinyPNGTinyPNG (by Tinify) is a free image optimization service built for developers and designers. It utilizes smart lossy compression to reduce the file sizes of JPEG, PNG, WebP, and AVIF files by up to 80% with no visible quality loss. That means faster load times, better SEO, and lower bandwidth. You can compress, convert, and resize images via a clean web interface or integrate it into your workflow with the API. The platform also provides an image CDN for fast global delivery of optimized assets. SDKs are available for Python, Node.js, PHP, Java, Ruby, and .NET. WordPress plugin included, plus plenty of community-driven integrations. No tuning, no noise, Tinify just works. Whether you're optimizing a handful of images or processing millions, it scales effortlessly. All plans include a generous free tier, and support is quick when you need it. George the panda 🐼 approves.
Description
PyQtGraph is a graphics and GUI library developed in pure Python, utilizing PyQt/PySide alongside NumPy, designed primarily for applications in mathematics, science, and engineering. Despite its complete implementation in Python, the library achieves impressive speed by effectively utilizing NumPy for numerical computations and the Qt GraphicsView framework for efficient rendering. Released under the MIT open-source license, PyQtGraph supports fundamental 2D plotting through interactive view boxes, enabling line and scatter plots with user-friendly mouse control for panning and scaling. Its ability to handle various data types, including integers, floats, and different bit depths, is complemented by functionalities for slicing multidimensional images at various angles, making it particularly useful for MRI data analysis. Furthermore, it facilitates rapid updates suitable for video display or real-time interactions, along with image display features that include interactive lookup tables and level adjustments. The library also provides mesh rendering capabilities with isosurface generation, while interactive viewports allow users to rotate and zoom with ease using the mouse. Additionally, it incorporates a basic 3D scenegraph, simplifying the programming process for three-dimensional data visualization. With its robust set of features, PyQtGraph caters to a wide range of visualization needs and enhances user experience through interactivity.
Description
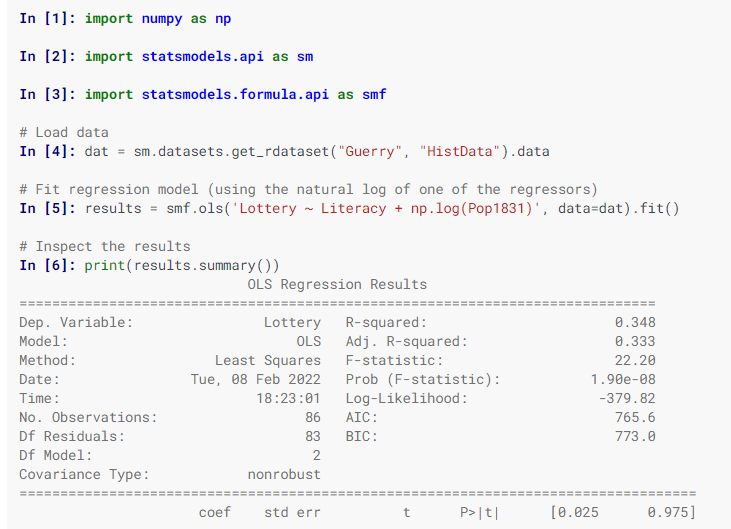
Statsmodels is a Python library designed for the estimation of various statistical models, enabling users to perform statistical tests and explore data effectively. Each estimator comes with a comprehensive array of result statistics, which are validated against established statistical software to ensure accuracy. This package is distributed under the open-source Modified BSD (3-clause) license, promoting free use and modification. Users can specify models using R-style formulas or utilize pandas DataFrames for convenience. To discover available results, you can check dir(results), and you will find that attributes are detailed in results.__doc__, while methods include their own docstrings for further guidance. Additionally, numpy arrays can be employed as an alternative to formulas. For most users, the simplest way to install statsmodels is through the Anaconda distribution, which caters to data analysis and scientific computing across various platforms. Overall, statsmodels serves as a powerful tool for statisticians and data analysts alike.
API Access
Has API
API Access
Has API


Pricing Details
Free
Free Trial
Free Version
Pricing Details
Free
Free Trial
Free Version
Deployment
Web-Based
On-Premises
iPhone App
iPad App
Android App
Windows
Mac
Linux
Chromebook
Deployment
Web-Based
On-Premises
iPhone App
iPad App
Android App
Windows
Mac
Linux
Chromebook
Customer Support
Business Hours
Live Rep (24/7)
Online Support
Customer Support
Business Hours
Live Rep (24/7)
Online Support
Types of Training
Training Docs
Webinars
Live Training (Online)
In Person
Types of Training
Training Docs
Webinars
Live Training (Online)
In Person
Vendor Details
Company Name
PyQtGraph
Website
www.pyqtgraph.org
Vendor Details
Company Name
statsmodels
Website
www.statsmodels.org/stable/index.html
