Average Ratings 860 Ratings
Average Ratings 27 Ratings
Description
Grafana Labs delivers the leading AI-powered observability platform, built around Grafana—the most widely adopted open source technology for dashboards and visualization. Recognized as a Leader in the 2025 Gartner® Magic Quadrant™ for Observability Platforms, Grafana Labs supports more than 25 million users and thousands of organizations worldwide, from startups to Fortune 500 enterprises.
Grafana Cloud is the open observability cloud, designed to help engineering teams observe everything and solve anything. Built on open source, open standards, and open ecosystems, it unifies metrics, logs, traces, and profiles in a single platform for full-stack visibility across applications, infrastructure, and digital experiences.
At the core is the open-source LGTM stack: Grafana for dashboards and visualization, Mimir for metrics, Loki for logs, and Tempo for distributed tracing. Native OpenTelemetry and Prometheus support allow teams to ingest telemetry from virtually any environment, while hundreds of integrations connect existing tools and data sources without costly rip-and-replace migrations.
Grafana Cloud combines powerful analytics with AI-driven observability. Grafana Assistant helps engineers investigate issues, explore telemetry, and troubleshoot faster. Adaptive Telemetry identifies the data that matters most and aggregates the rest, helping organizations reduce telemetry costs while preserving valuable insights
.
With solutions for Kubernetes monitoring, application observability, digital experience monitoring, incident response, synthetic monitoring, and performance testing, Grafana Cloud delivers a complete observability platform that scales with your business.
Description
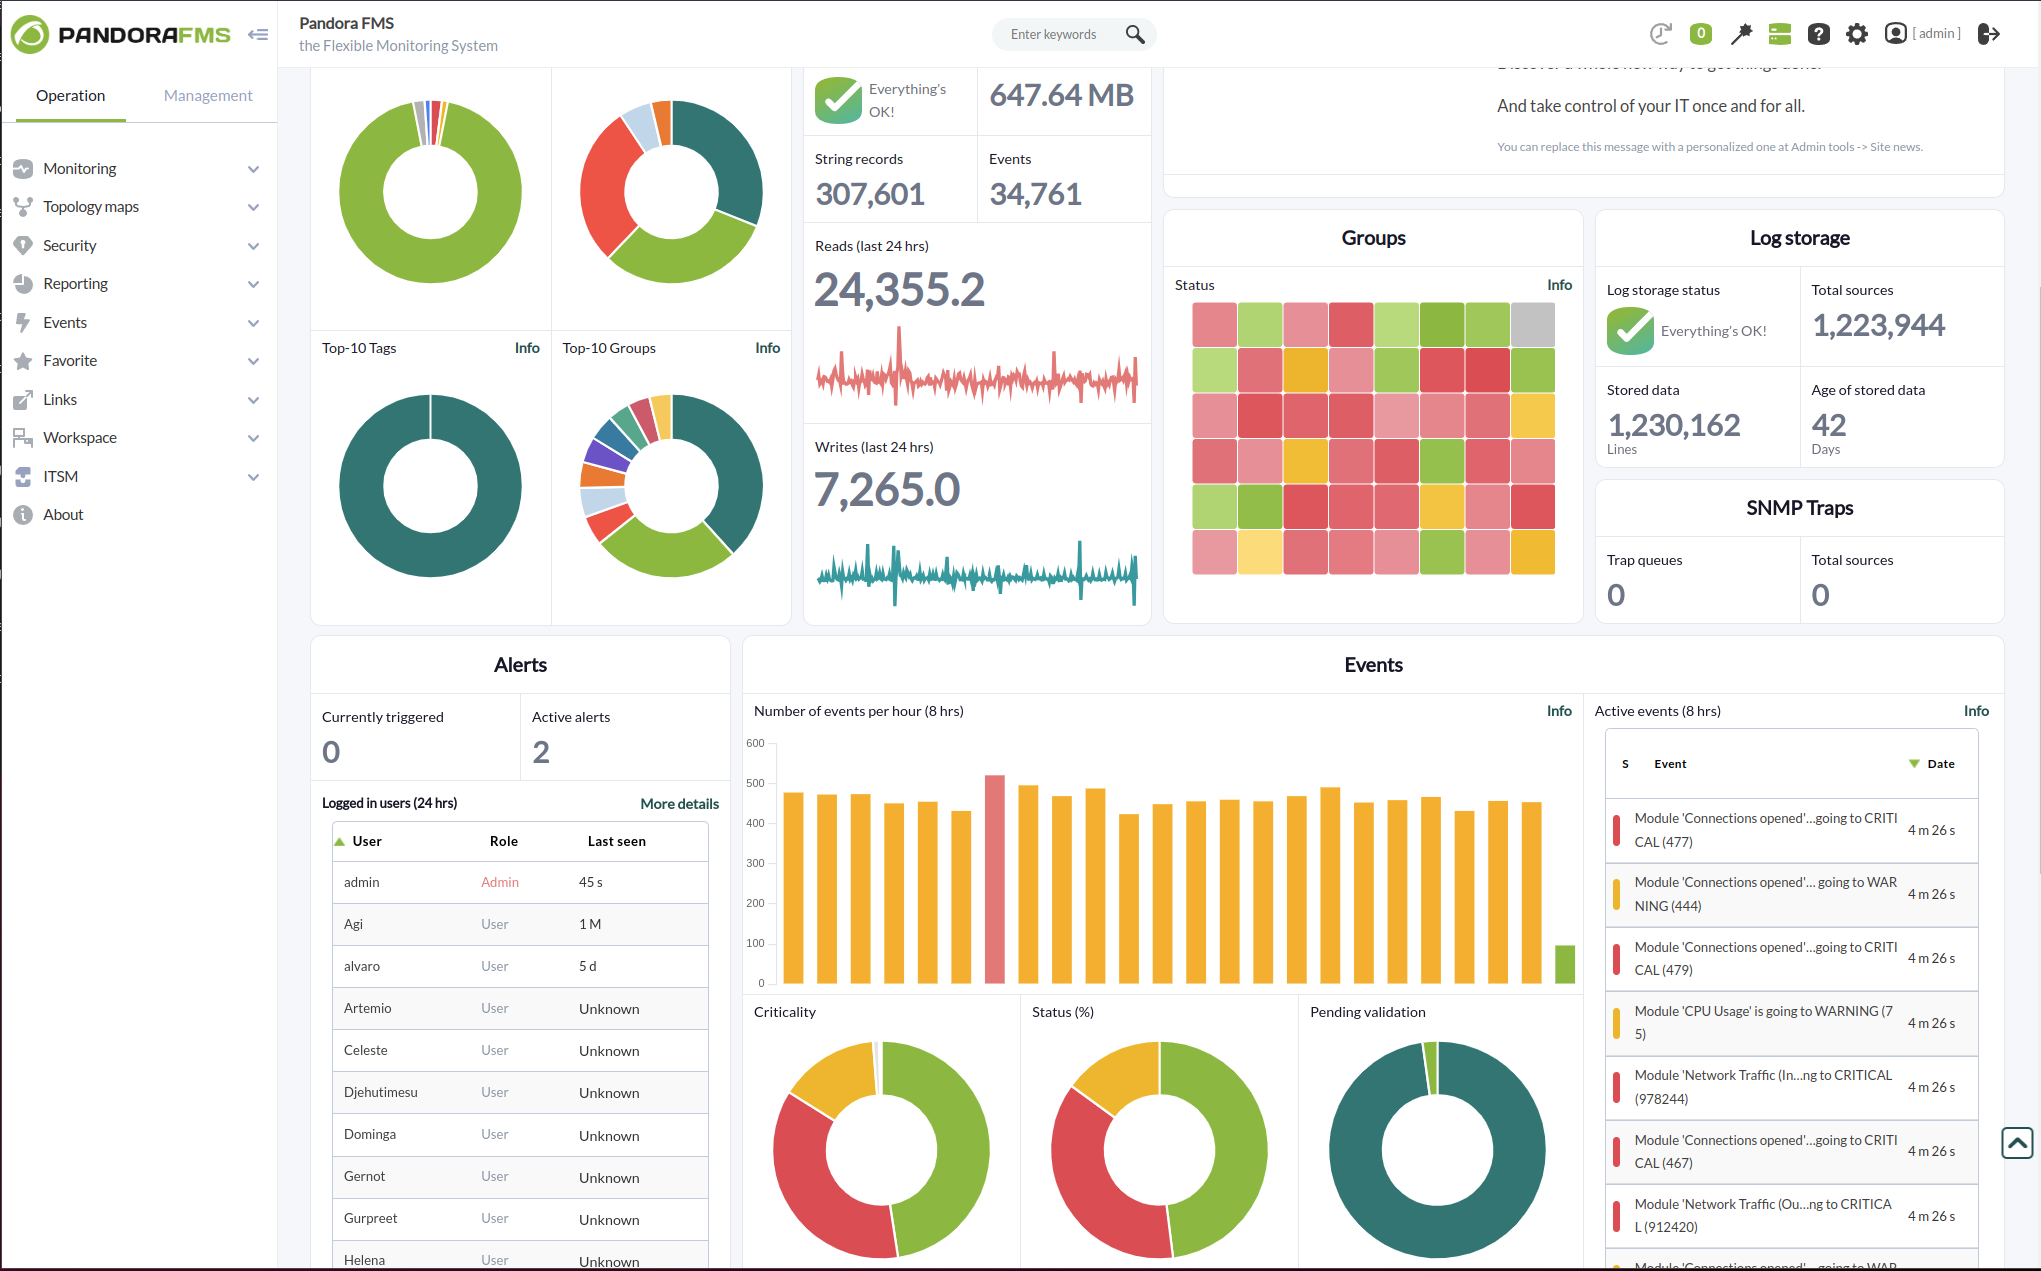
With more than 50,000 customer installations across the five continents, Pandora FMS is a truly all-in-one monitoring solution, covering all traditional silos for specific monitoring: servers, networks, applications, logs, synthetic/transactional, remote control, inventory, etc.
Pandora FMS allows you to quickly find and solve problems. It scales them so that they can be derived either from on-premise, multi-cloud, or both. You now have the ability to use your entire IT stack and analytics to solve any problem, even those that are difficult to find.
You can control and manage any technology and application with more than 500 plugins, including SAP, Oracle, Lotus or Citrix, Jboss, VMware, AWS and SQL Server.
API Access
Has API
Yes
API Access
Has API
Yes




Integrations
Azure Marketplace
Yes
SKUDONET
Yes
APERIO DataWise
Yes
Active Directory
No
Alfresco Digital Business Platform
No
BizTalk Server
No
Causal
Yes
Cloud Ops Group
Yes
Curity
Yes
Devtron
Yes
Integrations
Azure Marketplace
Yes
SKUDONET
Yes
APERIO DataWise
No
Active Directory
Yes
Alfresco Digital Business Platform
Yes
BizTalk Server
Yes
Causal
No
Cloud Ops Group
No
Curity
No
Devtron
No
Pricing Details
$0
Forever Free Tier: All Grafana Cloud services, up to 10k metrics, 50GB logs, traces & profiles; 14-day retention; 3 active users
Pro: from $19/month + usage
Enterprise: from $25K/year
Pro: from $19/month + usage
Enterprise: from $25K/year
Free Trial
Yes
Free Version
Yes
Pricing Details
€90/month
On-premise, SaaS and subscription models available.
Free Trial
Yes
Free Version
Yes
Deployment
Web-Based
Yes
On-Premises
Yes
iPhone App
No
iPad App
No
Android App
No
Windows
Yes
Mac
Yes
Linux
Yes
Chromebook
No
Deployment
Web-Based
Yes
On-Premises
Yes
iPhone App
Yes
iPad App
Yes
Android App
Yes
Windows
Yes
Mac
Yes
Linux
Yes
Chromebook
No
Customer Support
Business Hours
Yes
Live Rep (24/7)
Yes
Online Support
Yes
Customer Support
Business Hours
Yes
Live Rep (24/7)
Yes
Online Support
Yes
Types of Training
Training Docs
Yes
Webinars
Yes
Live Training (Online)
Yes
In Person
Yes
Types of Training
Training Docs
Yes
Webinars
Yes
Live Training (Online)
Yes
In Person
Yes
Vendor Details
Company Name
Grafana Labs
Founded
2014
Country
United States
Website
grafana.com
Vendor Details
Company Name
Pandora FMS
Founded
2005
Country
Spain
Website
pandorafms.com
Product Features
Application Performance Monitoring (APM)
Baseline Manager
Yes
Diagnostic Tools
Yes
Full Transaction Diagnostics
Yes
Performance Control
Yes
Resource Management
Yes
Root-Cause Diagnosis
Yes
Server Performance
Yes
Trace Individual Transactions
Yes
Dashboard
Annotations
Yes
Data Source Integrations
Yes
Functions / Calculations
Yes
Interactive
Yes
KPIs
Yes
OLAP
Yes
Private Dashboards
Yes
Public Dashboards
Yes
Scorecards
Yes
Themes
Yes
Visual Analytics
Yes
Widgets
Yes
Data Visualization
Analytics
Yes
Content Management
Yes
Dashboard Creation
Yes
Filtered Views
Yes
OLAP
Yes
Relational Display
Yes
Simulation Models
Yes
Visual Discovery
Yes
Database Monitoring
Anomaly Detection
Yes
Autodiscovery
Yes
Capacity Planning
Yes
Dashboard
Yes
Dependency Tracking
No
Historical Trend Analysis
Yes
Multitenancy
Yes
Notifications / Alerts
Yes
Performance Monitoring
Yes
Permissions / Access Controls
Yes
Predictive Analytics
Yes
Prioritization
No
Query Analysis
Yes
Resource Optimization
Yes
Troubleshooting
Yes
Incident Management
Audit Trail
Yes
Corrective Actions (CAPA)
Yes
Disaster Recovery
Yes
IT Incident Management
Yes
Incident Reporting
Yes
OSHA Compliance
No
Root-Cause Diagnosis
Yes
Safety Management
No
Task Management
Yes
Ticket Management
Yes
Incident Response
Attack Behavior Analytics
No
Automated Remediation
No
Compliance Reporting
No
Forensic Data Retention
No
Incident Alerting
No
Incident Database
No
Incident Logs
No
Incident Reporting
No
Privacy Breach Reporting
No
SIEM Data Ingestion / Correlation
No
SLA Tracking / Management
No
Security Orchestration
No
Threat Intelligence
No
Timeline Analysis
No
Workflow Automation
No
Workflow Management
No
IT Alerting
Alert Noise Reduction
Yes
Alert Routing
Yes
Dynamic Notifications
Yes
Enriched Incident Context
Yes
Escalation Policies
Yes
Incident History Audit
Yes
Multi-User Alerting
Yes
Multiple Alert Types
Yes
On-Call Management
Yes
Rich HTML Email Notifications
Yes
IT Infrastructure Monitoring
Alerts / Notifications
Yes
Application Monitoring
Yes
Bandwidth Monitoring
Yes
Capacity Planning
Yes
Configuration Change Management
Yes
Data Movement Monitoring
Yes
Health Monitoring
Yes
Multi-Platform Support
Yes
Performance Monitoring
Yes
Point-in-Time Visibility
Yes
Reporting / Analytics
Yes
Virtual Machine Monitoring
Yes
Performance Testing
API Testing
No
Benchmarking
No
Cross Browser Testing
No
Debugging
No
Historical Reporting
No
Load Testing
No
Mobile Testing
No
Parallel Testing
No
Regression Testing
No
UI Testing
No
Web Testing
No
Reporting
Customizable Dashboard
Yes
Data Source Connectors
Yes
Drag & Drop
Yes
Drill Down
Yes
Email Reports
Yes
Financial Reports
No
Forecasting
Yes
Marketing Reports
No
OLAP
Yes
Report Export
Yes
Sales Reports
No
Scheduled / Automated Reports
Yes
Product Features
Business Activity Monitoring
Alerts / Notifications
Yes
Business Process Management
Yes
Cross Application Analysis
No
Email Monitoring
Yes
Events Monitoring
Yes
KPI Monitoring
Yes
Pre-Configured Events
No
Reporting / Analytics
Yes
Workflow Management
No
Cloud Management
Access Control
No
Billing & Provisioning
No
Capacity Analytics
Yes
Cost Management
Yes
Demand Monitoring
Yes
Multi-Cloud Management
No
Performance Analytics
Yes
SLA Management
Yes
Supply Monitoring
Yes
Workflow Approval
No
Database Monitoring
Anomaly Detection
No
Autodiscovery
Yes
Capacity Planning
Yes
Dashboard
Yes
Dependency Tracking
Yes
Historical Trend Analysis
Yes
Multitenancy
Yes
Notifications / Alerts
Yes
Performance Monitoring
Yes
Permissions / Access Controls
Yes
Predictive Analytics
Yes
Prioritization
Yes
Query Analysis
Yes
Resource Optimization
Yes
Troubleshooting
Yes
IT Alerting
Alert Noise Reduction
Yes
Alert Routing
Yes
Dynamic Notifications
Yes
Enriched Incident Context
Yes
Escalation Policies
Yes
Incident History Audit
Yes
Multi-User Alerting
Yes
Multiple Alert Types
Yes
On-Call Management
No
Rich HTML Email Notifications
Yes
IT Infrastructure Monitoring
Alerts / Notifications
Yes
Application Monitoring
Yes
Bandwidth Monitoring
Yes
Capacity Planning
Yes
Configuration Change Management
Yes
Data Movement Monitoring
Yes
Health Monitoring
Yes
Multi-Platform Support
Yes
Performance Monitoring
Yes
Point-in-Time Visibility
Yes
Reporting / Analytics
Yes
Virtual Machine Monitoring
Yes
Network Mapping
Color Codes / Icons
Yes
Compliance Management
No
Device Auto Discovery
Yes
Hierarchical Mapping
Yes
Location-Based Mapping
No
Map Exporting
No
On-Demand Mapping
Yes
Reporting/Analytics
Yes
Self-Updating Maps
Yes
Web Traffic Reporting
No
Network Monitoring
Bandwidth Monitoring
Yes
Baseline Manager
Yes
Diagnostic Tools
Yes
IP Address Monitoring
Yes
Internet Usage Monitoring
Yes
Real Time Analytics
Yes
Resource Management
Yes
SLA Monitoring
Yes
Server Monitoring
Yes
Uptime Monitoring
Yes
Web Traffic Reporting
Yes
RMM
Deployment Management
Yes
For MSPs
Yes
IT Asset Management
Yes
Mobile Access
No
Network Monitoring
Yes
Patch Management
Yes
Real-time Alerts
Yes
Remediation Management
Yes
Server Management
CPU Monitoring
Yes
Credential Management
No
Database Servers
Yes
Email Monitoring
Yes
Event Logs
Yes
History Tracking
Yes
Patch Management
Yes
Scheduling
Yes
User Activity Monitoring
No
Virtual Machine Monitoring
Yes
System Monitoring
Alerts / Notifications
Yes
Antivirus Management
Yes
Data Backup / Recovery
Yes
Device Monitoring
Yes
Inventory Management
Yes
Patch Management
Yes
Policy-based Automation
Yes
Remote Monitoring
Yes
Reporting / Analytics
Yes
Risk Analysis
Yes
Server Monitoring
Yes
Service Configuration Management
Yes
Website Monitoring
Availability Testing
Yes
Event Logs
Yes
Event-Based Notifications
Yes
FTP Monitoring
Yes
Mail Server Monitoring
Yes
Maintenance Scheduling
Yes
Performance Metrics
Yes
Real Time Monitoring
Yes
Transaction Monitoring
Yes
Uptime Reporting
Yes
