Average Ratings 0 Ratings
Average Ratings 0 Ratings
Similar Products
-
HighchartsHighcharts, a Javascript-based charting library, makes it easy to add interactive charts and graphs to web or mobile projects of any size. Highcharts is used by more than 80% of the 100 biggest companies in the world, as well as thousands of developers from a variety of industries, including finance, publishing, application development, and data science. Highcharts is in active development since 2009. It remains a favorite among developers due to its robust feature set and ease-of-use documentation, accessibility features and vibrant community.
-
DXchartsIn just a few days, you can integrate and customize a lightning-fast financial table with your product. You can make changes or create a completely new interface. You want more? We offer a full access alternative. Data feeds with futures and indices, equities, FX and cryptocurrencies by default. Sign up now to get your data feeds. DXcharts can be integrated with any market data source, as it is data feed-agnostic. Native libraries for all platforms. Native web, native mobile & desktop. Get a solution that is specifically tailored to your product. Analyzing statistics from trading activity can help you evaluate securities and predict their future movements. You can create custom studies with the intuitive dxScript. You can adjust the layout of charts however you like and sync them by instrument, chart type and timeframe, range, studies & appearance.
-
TradingView Stock WidgetsAs fast as it takes to make a cup of coffee, grab powerful charts and add real-time financial information to your website. Simply copy and paste our iFrame codes, and you're good to go. Our display ratings make it easy to see the technical analysis of a symbol. This widget is ideal for macro-level analysis of the markets. This widget is especially useful on homepages. The widget displays the top five most active stocks, as well as the losing and winning stocks. It updates based upon current market activity so you always see the most relevant stocks. Keep an eye out for announcements and important economic events. You can also set up filters in just a few clicks. Our scrolling ticker tape allows you to go vintage Wall Street. This stock exchange-style ticker can be embedded in just a few clicks. You don't need a power suit or expensive watch.
-
SmartDrawSmartDraw makes professional drawings and diagrams accessible to everyone. Non-technical users can quickly create floor plans, while professionals get the precision and scale they require. With industry-leading floor planning tools and an intuitive interface for traditional diagramming like flowcharts and organizational charts, SmartDraw delivers enterprise-ready power without unnecessary complexity. Key features: - Large collection of symbols and templates - Ability to create custom shapes - Import PDFs, images, Google Maps, Visio files, Visio stencils - Draw to any scale - Enrich drawings with data - Generate manifest and bills of materials - Generate diagrams from data automatically like org charts, AWS, Azure, PI Boards, and more - Use natural language text prompts to generate diagrams with AI - Save files directly to OneDrive, SharePoint, or Google Drive, or other preferred provider - Integrations with the Microsoft and Google enterprise stack plus Confluence and Jira SmartDraw supports a wide range of industries and real-world use cases, helping teams plan, document, and communicate more effectively. Construction professionals use it to create scaled floor plans, site layouts, and electrical and plumbing drawings. Fire departments rely on it for fire pre-planning and incident documentation, while police departments use it for accident reconstruction and crime scene diagrams. IT teams build network diagrams and cloud architectures, HR leaders create organizational charts, and product managers map out processes and workflows. From physical layouts to business processes, SmartDraw provides a single platform that adapts to the needs of each role and industry.
-
BudgytYou know the pain. 8,000+ formulas in your Excel budget, any one of which could break. Department heads emailing versions back and forth. Mystery errors appearing right before board meetings. Weekends lost hunting for that one number that doesn't add up. We built Budgyt because we lived that nightmare as CFOs ourselves. It's a true database that works like Excel, so your team doesn't need training. But formulas never break. Every number traces back to source with one click. Import your chart of accounts and actuals directly from your accounting system. Click any variance to drill down to vendor-level detail instantly. Run rolling reforecasts every month without rebuilding everything from scratch. We connected it via API so you're up and running in hours, not spending months on implementation consulting. Built for multi-department organizations where budgeting needs to be collaborative, but the finance team needs to stay in control. No more emailing spreadsheets around. No more "did I break something?" panic. Just budgeting that actually works.
-
RunnRunn is a real-time resource management platform with integrated time tracking and powerful forecasting capabilities. Intuitively plan projects and schedule resources with allocations, project phases, milestones, and time off. Flick between monthly, quarterly and half-yearly views to plan for the short and long term. Get a dynamic bird’s-eye view of your entire organization to manage capacity, workload and availability changes as you create your plans. Runn makes resource management dynamic and visual from a single, shared view. Drill into different roles, teams and tags to compare trends and understand which groups are overbooked. Plan out tentative projects to see how plans might change if work gets confirmed. Track projects, view forecasts, and get relevant metrics within Runn. Get insights like utilization, project variance, and overall financial performance. Use Runn’s built-in timesheets to monitor project progress. Runn integrates with Harvest, WorkflowMax, and Clockify. With the API, build your own integrations to connect Runn with your favorite tools.
-
GWIAnnually, we conduct surveys with over a million individuals worldwide, enabling businesses to swiftly grasp evolving consumer trends. Our user-friendly platform is tailored for busy teams, facilitating the extraction of essential information, customized analysis, and seamless sharing. Identify your ideal customer using more than 250,000 profiling metrics. Utilize question charts to gain insights into the thoughts, emotions, and actions of your audience. Aggregate data and visualizations to craft a compelling narrative for your team. Combine various data points for comprehensive analysis and deeper understanding. Access unparalleled insights into consumer behavior through survey results that capture the perspectives, interests, and actions of billions of individuals globally. We consistently pose the same survey questions across different regions, allowing for detailed insights into local markets while also providing a broader global perspective. Discover what consumers genuinely think about your brand and its competitors, gaining valuable insights into industry leaders and their market positions. This holistic approach ensures that businesses can navigate the complexities of consumer perception effectively.
-
Grafana CloudGrafana Labs delivers the leading AI-powered observability platform, built around Grafana—the most widely adopted open source technology for dashboards and visualization. Recognized as a Leader in the 2025 Gartner® Magic Quadrant™ for Observability Platforms, Grafana Labs supports more than 25 million users and thousands of organizations worldwide, from startups to Fortune 500 enterprises. Grafana Cloud is the open observability cloud, designed to help engineering teams observe everything and solve anything. Built on open source, open standards, and open ecosystems, it unifies metrics, logs, traces, and profiles in a single platform for full-stack visibility across applications, infrastructure, and digital experiences. At the core is the open-source LGTM stack: Grafana for dashboards and visualization, Mimir for metrics, Loki for logs, and Tempo for distributed tracing. Native OpenTelemetry and Prometheus support allow teams to ingest telemetry from virtually any environment, while hundreds of integrations connect existing tools and data sources without costly rip-and-replace migrations. Grafana Cloud combines powerful analytics with AI-driven observability. Grafana Assistant helps engineers investigate issues, explore telemetry, and troubleshoot faster. Adaptive Telemetry identifies the data that matters most and aggregates the rest, helping organizations reduce telemetry costs while preserving valuable insights . With solutions for Kubernetes monitoring, application observability, digital experience monitoring, incident response, synthetic monitoring, and performance testing, Grafana Cloud delivers a complete observability platform that scales with your business.
-
DbVisualizerDbVisualizer is a universal database client for anyone who works with data, from indie developers and startups to professional teams managing complex database environments, including developers, DBAs, analysts, and data engineers working across relational and NoSQL databases. Key features: - SQL editor with intelligent autocomplete, visual query builders, variables, and execution tools - AI Assistant for answering questions, explaining errors, and analyzing code - Git integration for managing SQL scripts and team collaboration - Customizable layouts, key bindings, and UI themes - Favorites for frequently used scripts and database objects - Configurable security settings for organizational requirements Connects via JDBC to MySQL, PostgreSQL, SQL Server, Oracle, Snowflake, SQLite, Cassandra, BigQuery, and more. Runs on Windows, macOS, and Linux. Nearly 7 million downloads, with Pro users in 150 countries, scaling from solo projects to enterprise database management.
-
TIMiHigh-Performance Data Engineering. Total Sovereignty. TIMi delivers the power of a complete cloud data stack—on-premises, fully sovereign, and ridiculously fast. We reject artificial vendor lock-in and hidden costs. Instead, we offer absolute peace of mind through engineering excellence, giving your team the freedom to experiment, innovate, and solve complex AI, analytics, and automation challenges in record time. Why Top Enterprises Choose TIMi? Enterprise Integration & *No-Code* ETL/Data preparation: Automate complex workflows and seamlessly link your entire stack: SAP, Salesforce, SharePoint, S3, Azure Storage, PowerBI, Tableau, etc. Unmatched Infrastructure Efficiency: Our competitors such as Databricks, Dataiku, and MS Fabric all rely on Spark—and that makes them inherently inefficient since a single €2k TIMi server outperforms a 267-node Spark cluster. TIMi process billions of rows in seconds and manage petabyte-scale data lakes at a fraction of the cost. Proven AI Leadership: Harness pioneering machine learning from the creators of the first Auto-ML engine (est. 2007). Whether deployed on-premises or via our EU-Hosted Sovereign Cloud, TIMi empowers leaders in Banking, Telecoms, Manufacturing, Retail, Defense and Government.
Description
ChartOmodo is an online tool designed for creating charts and dashboards specifically aimed at users who manage data within Notion. It seamlessly integrates with selected Notion databases in a read-only format or allows for CSV uploads, transforming data rows into charts that can easily be embedded back into Notion pages. Users have the flexibility to select from 18 different types of charts, configure axes, set up aggregations, apply filters, organize by dates, and manage series, all while having the option to share individual charts or compile them into comprehensive dashboards. The charts automatically refresh based on the user’s subscription plan, and rollup and formula values can be visualized alongside other database attributes. For those on the Pro and Business plans, additional features include connections to PostgreSQL, Google Analytics 4, Google Search Console, and a beta version of Stripe, with the API also capable of receiving data sets and returning chart data. A free plan is available for users, permitting the creation of up to five charts, while the paid plans offer expanded capabilities, including more charts, dashboards, additional connectors, and enhanced customization options, catering to a broad range of data visualization needs. Overall, ChartOmodo simplifies the process of data visualization for Notion users, making it a valuable tool for teams seeking to enhance their data presentation.
Description
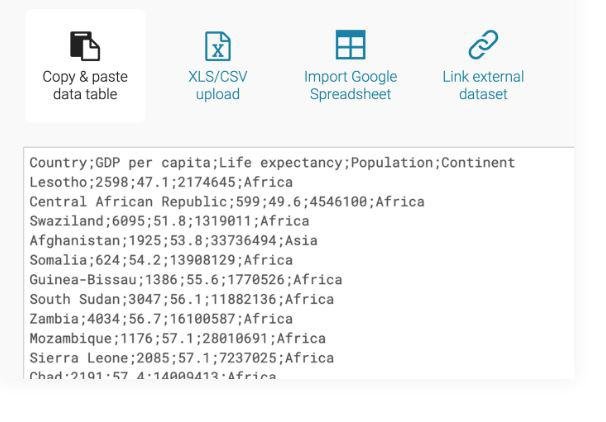
Enhance your narratives with a variety of charts, maps, and tables designed for optimal engagement. Our platform provides 19 interactive and responsive chart options, which range from straightforward bar and line visuals to more complex arrow, range, and scatter plots. Additionally, we feature three types of interactive and responsive maps, suitable for creating everything from basic locator maps to detailed thematic choropleth and symbol maps. Our newly designed responsive data tables offer extensive styling possibilities and support the inclusion of bar and line charts, images, as well as a search function and pagination for easy navigation. Datawrapper empowers some of the leading teams worldwide to effectively communicate their messages through the use of data. Our mission is to make it possible for everyone, including you, to craft stunning charts, maps, and tables effortlessly. You can easily transfer your data from online sources, Excel, or Google Sheets, and we also allow for CSV/XLS file uploads or linking to a URL or Google Sheet for real-time chart updates. With just a click, you can select from numerous chart and map types, after which you can personalize and annotate your visuals to enhance their impact and clarity. This user-friendly approach to data visualization ensures that everyone can tell compelling stories backed by accurate data.
API Access
Has API
Yes
API Access
Has API
Yes




Integrations
Google Analytics
Yes
Google Search Console
Yes
Google Sheets
No
Make
Yes
Microsoft Excel
No
Nocode HQ
No
Notion
Yes
PostgreSQL
Yes
SPP.co
No
Stripe
Yes
Integrations
Google Analytics
No
Google Search Console
No
Google Sheets
Yes
Make
No
Microsoft Excel
Yes
Nocode HQ
Yes
Notion
No
PostgreSQL
No
SPP.co
Yes
Stripe
No
Pricing Details
$5/month
Free: $0 for up to 5 charts, with no card or expiry. Starter: $5/month or $50/year billed annually. Pro: $12/month or $120/year billed annually. Business: $20/month or $200/year billed annually. Enterprise pricing is scoped per customer. Pro and higher plans include external data connectors; features and limits vary by plan.
Free Trial
No
Free Version
Yes
Pricing Details
€199 per month
Free Trial
No
Free Version
No
Deployment
Web-Based
Yes
On-Premises
No
iPhone App
No
iPad App
No
Android App
No
Windows
No
Mac
No
Linux
No
Chromebook
No
Deployment
Web-Based
Yes
On-Premises
No
iPhone App
No
iPad App
No
Android App
No
Windows
No
Mac
No
Linux
No
Chromebook
No
Customer Support
Business Hours
No
Live Rep (24/7)
Yes
Online Support
Yes
Customer Support
Business Hours
No
Live Rep (24/7)
No
Online Support
Yes
Types of Training
Training Docs
Yes
Webinars
No
Live Training (Online)
Yes
In Person
No
Types of Training
Training Docs
Yes
Webinars
No
Live Training (Online)
No
In Person
Yes
Vendor Details
Company Name
Asak Digital Agency
Founded
2010
Country
Indonesia
Website
chartomodo.com
Vendor Details
Company Name
Datawrapper
Founded
2012
Country
Germany
Website
www.datawrapper.de/
Product Features
Dashboard
Annotations
No
Data Source Integrations
No
Functions / Calculations
No
Interactive
No
KPIs
No
OLAP
No
Private Dashboards
No
Public Dashboards
No
Scorecards
No
Themes
No
Visual Analytics
No
Widgets
No
Data Visualization
Analytics
No
Content Management
No
Dashboard Creation
No
Filtered Views
No
OLAP
No
Relational Display
No
Simulation Models
No
Visual Discovery
No
Product Features
Data Visualization
Analytics
Yes
Content Management
No
Dashboard Creation
No
Filtered Views
No
OLAP
No
Relational Display
No
Simulation Models
Yes
Visual Discovery
No
Alternatives
No Alternatives
