Average Ratings 0 Ratings
Average Ratings 0 Ratings
Similar Products
-
SurveyJSSurveyJS is a set of four open-source JavaScript libraries that offer the benefits of a tailor-made in-house survey application, while considerably reducing the time and resources needed to deploy the system. These libraries are independent of specific server code or database requirements and seamlessly integrate with popular JavaScript frameworks, including React, Angular, Vue.js, jQuery, Knockout, and more. They are designed to communicate with any server that can handle JSON requests, ensuring compatibility with various server architectures and databases. The product family is composed of: - An open-source MIT-licensed rendering library that renders dynamic JSON-based forms in your web application, and collects responses. - A self-hosted drag & drop form builder that features an integrated CSS-based theme editor and a GUI for conditional rules. It automatically generates JSON definitions (schemas) of your forms in real time. - PDF Generator, a library that renders SurveyJS surveys and forms as PDF files in a browser; - The Dashboard library that allows you to simplify survey data analysis with interactive and customizable charts and tables. Visit our website to try out and evaluate our full-scale demo for free.
-
Visual PlanningVisual Planning is a powerful scheduling and resource management tool that's simple to use. Visual Planning is used by thousands of organizations to share their schedules and work more efficiently together.
-
Project InsightProject Insight is a strategic project and portfolio management software that gives companies a complete picture of the work happening across their entire organization. Streamline workflows, automate processes, enhance collaboration, and capture project data points from all your teams and systems in one central command center so you can make confident decisions about business. Manage work at the project, program or portfolio levels and integrate with the tools you already use, including Azure DevOps, Jira, Microsoft, Salesforce, and ServiceNow, and HubSpot to eliminate the need to manually key in data across teams. With the most views of any project management platform, teams can keep tabs on assignments, status, risks, resources, capacity, schedules, budgets, and more. Project Insight also offers free view only seats for clients. The power of AI can be used to assign action items after meetings, predict future capacity, balance workloads, & select the right resources. Additional AI-powered features include what if simulations to generate tradeoffs when priorities change and AI-generated project templates (WBS). Whether you are moving from basic spreadsheet project tracking or you have a sophisticated PMO with a complex web of unique business processes, Project Insight has the broad feature set to help you grow as you go. Our onboarding teams are known for being the best in the business and our platform can be fully customized to manage projects and data the way your company needs to.
-
GantticGanttic is a flexible drag-and-drop scheduler for resource planning. Its resource-centric Gantt charts provide a holistic view of your equipment, personnel, facilities, and vehicles, providing a clear understanding of who or what is engaged and when. Beyond its scheduling capabilities, Ganttic enables a deeper level of resource management and project portfolio oversight. Harness the power to optimize resource utilization, generate detailed reports, and establish project or resource-breakdown structures that streamline the planning process. Unlimited Custom Views help segment large resource pools, giving different managers the power to organize their teams and departments according to their own needs. Create unique data fields to incorporate data that matters, and ensuring the right resource is booked for the job. Easily share Views to facilitate collaboration among teams and stakeholders, while notifications, calendar syncs, and a mobile app keep the right individuals informed of any changes. With unlimited user access in all subscriptions, everyone stays up to date. Take advantage of a free 14 day trial with complimentary training and onboarding from our dedicated support team.
-
PlanfixThe Planfix platform allows organizations to manage their entire business online. Regardless of company size and industry, Planfix has something to offer as an excellent project and work management tool. With Planfix, your company gets a fully customizable management system, from process design to appearance. Planfix’s platform combines task and project management, CRM, sales, marketing, production, logistics, support service, accounting, and HR in one full-featured solution. Data is seamlessly transferred from one team to another - for example, a transaction at the implementation stage becomes a project and then is transferred to support. Planfix is equally well suited for businesses and non-profit organizations, public associations, or any other group of people working towards a common cause. Trusted by 7724 companies, automates business workflows of more than 68 000 users.
-
Zoho ProjectsProject management is as efficient as it gets. Zoho Projects, a cloud-based project management software, helps you plan and track your work efficiently. It also allows you to collaborate with your team from anywhere. To get things done on schedule, plan your project activities, assign work, manage your resources, and collaborate better with your team. Gantt charts can be used to create your project plan and track your tasks. Zoho Projects helps you keep track of your key tasks and their dependencies and shows you any deviations from your planned progress. Reduce time spent on repetitive tasks. Our project management software is easy to use, no matter how complex your process is. It has a drag-and drop interface that makes it easier to create and deploy new automations. The Projects timesheet module allows you to log both billable and unbilled hours. You can record every minute of your hardwork, manually or with timers. Our built-in integration with Zoho Invoice generates invoices.
-
SmartDrawSmartDraw makes professional drawings and diagrams accessible to everyone. Non-technical users can quickly create floor plans, while professionals get the precision and scale they require. With industry-leading floor planning tools and an intuitive interface for traditional diagramming like flowcharts and organizational charts, SmartDraw delivers enterprise-ready power without unnecessary complexity. Key features: - Large collection of symbols and templates - Ability to create custom shapes - Import PDFs, images, Google Maps, Visio files, Visio stencils - Draw to any scale - Enrich drawings with data - Generate manifest and bills of materials - Generate diagrams from data automatically like org charts, AWS, Azure, PI Boards, and more - Use natural language text prompts to generate diagrams with AI - Save files directly to OneDrive, SharePoint, or Google Drive, or other preferred provider - Integrations with the Microsoft and Google enterprise stack plus Confluence and Jira SmartDraw supports a wide range of industries and real-world use cases, helping teams plan, document, and communicate more effectively. Construction professionals use it to create scaled floor plans, site layouts, and electrical and plumbing drawings. Fire departments rely on it for fire pre-planning and incident documentation, while police departments use it for accident reconstruction and crime scene diagrams. IT teams build network diagrams and cloud architectures, HR leaders create organizational charts, and product managers map out processes and workflows. From physical layouts to business processes, SmartDraw provides a single platform that adapts to the needs of each role and industry.
-
WrikeWrike is a powerful work management platform that gives cross-functional teams full visibility into complex projects. Our cloud-based collaboration software software is trusted by 20,000+ leading companies around the world, including tech giants such as Fitbit and Siemens. Wrike boasts a wide range of award-winning features, including dynamic request forms, automated workflows, cross-tagging, custom item types, and 400+ app integrations. Work smarter with Work Intelligence™: our advanced communication software that offers voice commands, smart replies, and document processing. We also offer tailor-made templates to help teams kick-start Agile projects and tick every box for compliance. As well as 99.9% uptime, our enterprise-grade security offers single sign-on, role-based access control, and continuous data backup. For extra peace of mind, you can use the Wrike Lock add-on and gain full ownership of your master encryption key. Wrike has been proven to make organizational processes 40% more efficient, eliminating time-consuming admin work and reducing costs across the board. Discover how it can benefit your team — start your free two-week trial today.
-
ClickUpWork is broken because your tools are. Dozens of apps, zero shared context, your team stuck playing messenger between all of them. That's not collaboration. That's overhead. ClickUp eliminates the mess. One platform: tasks, docs, chat, goals, time tracking, whiteboards, and AI Agents that work autonomously while you sleep. Everything shares one connected brain. No silos. No duplicated effort. No lost threads. Manage any workflow with custom views, automations, and real-time collaboration baked into every layer. 15+ views including List, Board, Gantt, Timeline, and Calendar. Create rich documents with nested pages and embedded tasks. Set measurable goals with automatic rollups that connect daily output to company objectives. Track time natively with timers, estimates, and workload views that prevent burnout. Over 1,000 integrations plug into your existing stack without adding chaos. GitHub, Slack, Google Drive, Figma, Salesforce, Zoom, and hundreds more — all feeding into one system of record. Built-in AI writes, summarizes, and executes entire workflows on its own. Not a bolt-on — native intelligence woven through every feature. AI Agents handle complex multi-step work around the clock without waiting for humans. SOC 2 Type II certified. SSO/SAML. Custom roles. Audit logs. Scales from five people to fifty thousand. Stop patching a broken system. Start free today. No credit card, no commitment.
-
JOpt.TourOptimizerJOpt.TourOptimizer is an enterprise optimization engine for route planning, scheduling, and resource allocation across logistics, transportation, dispatch, and field service operations. It is built for organizations that need to solve complex planning problems under real-world business constraints rather than simple consumer-grade route calculation. The platform supports vehicle routing and scheduling scenarios such as VRP, CVRP, VRPTW, pickup and delivery, multi-depot planning, heterogeneous fleets, and workforce scheduling. JOpt.TourOptimizer can model time windows, working hours, visit durations, capacities, skills and expertise levels, territories, zone governance, overnight stays, alternate destinations, and custom business rules. This makes it suitable for production deployments where feasibility, transparency, and operational reliability matter. It is designed to generate practical plans that help teams balance travel time, service commitments, workload distribution, and operational cost in demanding enterprise environments. The solution is available both as an embedded Java SDK and as a Docker-based REST API with OpenAPI and Swagger support. This allows software vendors, enterprise developers, and system integrators to embed advanced optimization into TMS, ERP, CRM, WMS, dispatch systems, customer platforms, and field service applications. With support for scalable integration and modern service architectures, JOpt.TourOptimizer helps organizations improve planning efficiency, service quality, SLA compliance, transparency, and operational resilience at scale. It also supports enterprise integration strategies that require reproducible optimization runs, structured outputs, and flexible deployment models.
Description
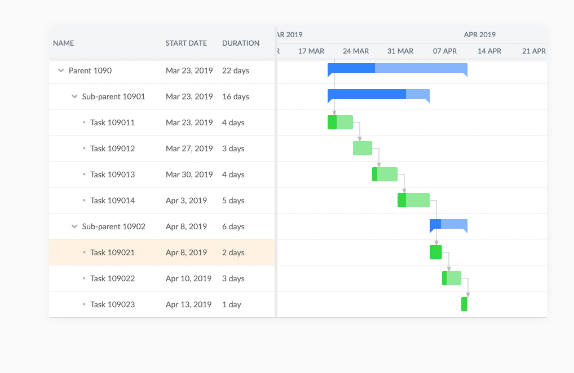
Bryntum stands out as a premier provider of advanced scheduling solutions designed for web applications. Our extensive collection of JavaScript components—featuring Gantt, Scheduler, Task Board, and Calendar—equips developers with the tools needed to create contemporary project management software that includes functionalities like drag-and-drop scheduling, efficient resource management, and dynamic timelines. With seamless compatibility with widely-used frameworks such as React, Angular, Vue, and Ext JS, we offer both flexibility and swift deployment. By enhancing planning processes and allowing for the visualization of intricate schedules, as well as optimizing resource utilization, Bryntum’s offerings enable organizations from various sectors to implement powerful and user-friendly project planning tools on a large scale. Ultimately, our commitment to innovation helps drive efficiency and effectiveness in project execution.
Description
FusionCharts is a leading data visualization tool that helps developers create interactive and responsive charts for web and mobile applications. With 100+ chart types including line, bar, area, pie charts, and 2000+ maps, it enables users to visualize complex data sets and make informed decisions.
The library is built on JavaScript and can be easily integrated with popular frameworks such as AngularJS, React, and Vue.js. Its user-friendly API and comprehensive documentation make it accessible to developers of all skill levels.
Additionally, the library offers a wide range of features such as real-time updates and cross-browser compatibility. It also has a wide range of customization options, allowing users to tailor charts to their specific needs. With over a decade of development and updates, FusionCharts is a reliable and robust choice for data visualization and is trusted by thousands of businesses and organizations worldwide.
API Access
Has API
Yes
API Access
Has API
Yes


Integrations
Angular
Yes
React
Yes
Vue.js
Yes
ASP.NET
No
Django
No
Ember
No
Flutter
No
Java
No
JavaScript
Yes
PHP
No
Integrations
Angular
Yes
React
Yes
Vue.js
Yes
ASP.NET
Yes
Django
Yes
Ember
Yes
Flutter
Yes
Java
Yes
JavaScript
No
PHP
Yes
Pricing Details
$680
EUL license (perpetual) for internal company use
OEM license (subscription) for commercial/SaaS use
OEM license (subscription) for commercial/SaaS use
Free Trial
Yes
Free Version
No
Pricing Details
$0
FusionCharts offers a free 14-day trial.
We offer annual or perpetual plans for:
• Basic for a small internal app or dashboard
• Pro for on-prem
• Enterprise for SaaS apps with large teams
• Enterprise+ for unifying your charts across your organization
We offer annual or perpetual plans for:
• Basic for a small internal app or dashboard
• Pro for on-prem
• Enterprise for SaaS apps with large teams
• Enterprise+ for unifying your charts across your organization
Free Trial
Yes
Free Version
No
Deployment
Web-Based
Yes
On-Premises
No
iPhone App
No
iPad App
No
Android App
No
Windows
No
Mac
No
Linux
No
Chromebook
No
Deployment
Web-Based
Yes
On-Premises
No
iPhone App
Yes
iPad App
Yes
Android App
Yes
Windows
Yes
Mac
Yes
Linux
Yes
Chromebook
No
Customer Support
Business Hours
Yes
Live Rep (24/7)
No
Online Support
Yes
Customer Support
Business Hours
Yes
Live Rep (24/7)
No
Online Support
Yes
Types of Training
Training Docs
Yes
Webinars
Yes
Live Training (Online)
Yes
In Person
Yes
Types of Training
Training Docs
Yes
Webinars
Yes
Live Training (Online)
No
In Person
No
Vendor Details
Company Name
Bryntum
Founded
2009
Country
Sweden
Website
www.bryntum.com
Vendor Details
Company Name
Idera, Inc.
Founded
2002
Country
USA
Website
www.fusioncharts.com
Product Features
Gantt Chart
Alerts/Notifications
No
Capacity Monitoring
No
Color Coding
Yes
Dependency Tracking
No
Drag & Drop
Yes
Milestone Tracking
No
Progress Tracking
Yes
Task Management
Yes
Templates
No
Kanban
Collaboration Tools
No
Dependency Tracking
No
KPI Monitoring
No
Milestone Tracking
No
Multi-Board
No
Prioritization
No
Project Planning
No
Roadmapping
No
Supports Scrum
No
Task Management
No
Time Tracking
No
Product Features
Dashboard
Annotations
Yes
Data Source Integrations
Yes
Functions / Calculations
Yes
Interactive
Yes
KPIs
Yes
OLAP
No
Private Dashboards
Yes
Public Dashboards
Yes
Scorecards
No
Themes
Yes
Visual Analytics
Yes
Widgets
Yes
Data Visualization
Analytics
Yes
Content Management
No
Dashboard Creation
Yes
Filtered Views
Yes
OLAP
No
Relational Display
Yes
Simulation Models
No
Visual Discovery
Yes
Gantt Chart
Alerts/Notifications
Yes
Capacity Monitoring
Yes
Color Coding
No
Dependency Tracking
Yes
Drag & Drop
Yes
Milestone Tracking
Yes
Progress Tracking
Yes
Task Management
Yes
Templates
No
Heatmap
Behavioral Mapping
Yes
Dashboard
Yes
Dynamic Maps
Yes
Element Analytics
Yes
Embeddable Maps
Yes
For Sales
Yes
For Science
No
Radial Mapping
No
Territorial Mapping
Yes
Website Analytics
Yes
